
Peek Into Future Through Futures, What To Expect Next Week
Following futures positions of non-commercials are as of March 10, 2020.
10-year note: Currently net short 214.6k, up 57.9k. (SPTL)
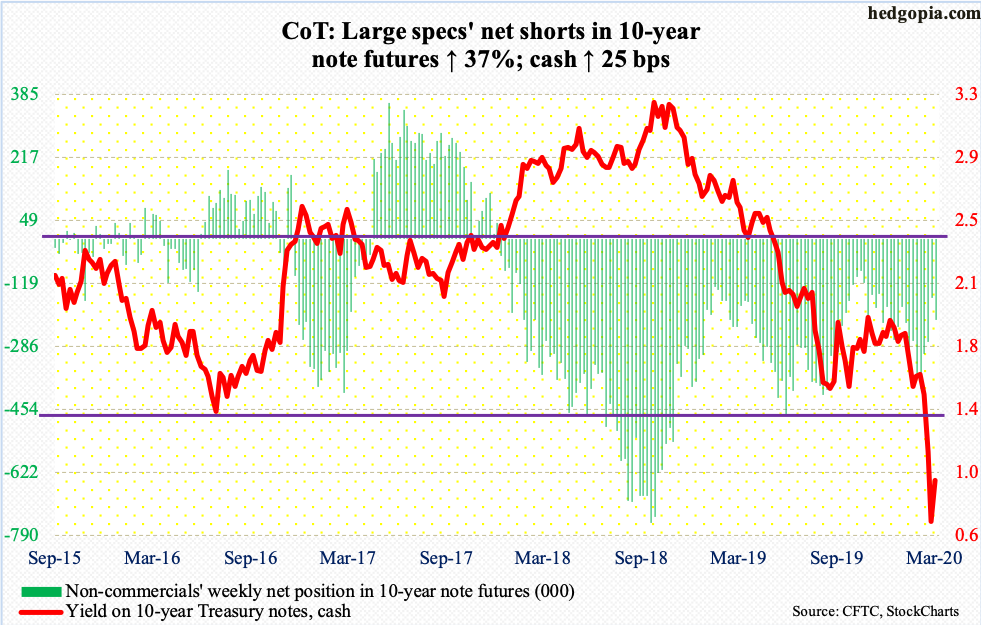
Next week, the FOMC meets.This follows a 50-basis-point emergency cut of last week, to a range of 100 to 125 basis points.In the futures market, traders expect one full point cut on Wednesday. Then, we are talking zero-bound territory, which also means the next round of stimulus will come from unconventional measures.
During and after the 2008/2009 financial crisis, the Fed launched three iterations of quantitative easing, pushing its balance sheet into bloated territory. SOMA (System Open Market Account) holdings went from under $500 billion pre-crisis to $4.24 trillion in April 2017.This week, they were $3.87 trillion, up from $3.55 trillion late September last year.
It is all but certain the Fed will be deploying new tools in the months/quarters to come.Lael Brainard, FOMC governor, suggested recently the central bank might turn to yield control – a la Japan targeting a longer-term interest rate.The Fed is yet to try out purchases of corporate bonds, a practice pursued by both the ECB and the BoJ.The latter also buys equity ETFs.
In the end, it is not what the Fed does that matters, but if markets have conviction in what it does. Unlike in the past, last week’s intra-meeting cut was unable to soothe investor nerves. The coronavirus is proving to be a threat to the smooth functioning of the global supply chain. Markets are not convinced the Fed has the right tools for this problem. It is too soon to discard the ‘do not fight the Fed’ axiom, but markets’ most recent reaction function is a reminder that the bank does not have a cure-all.
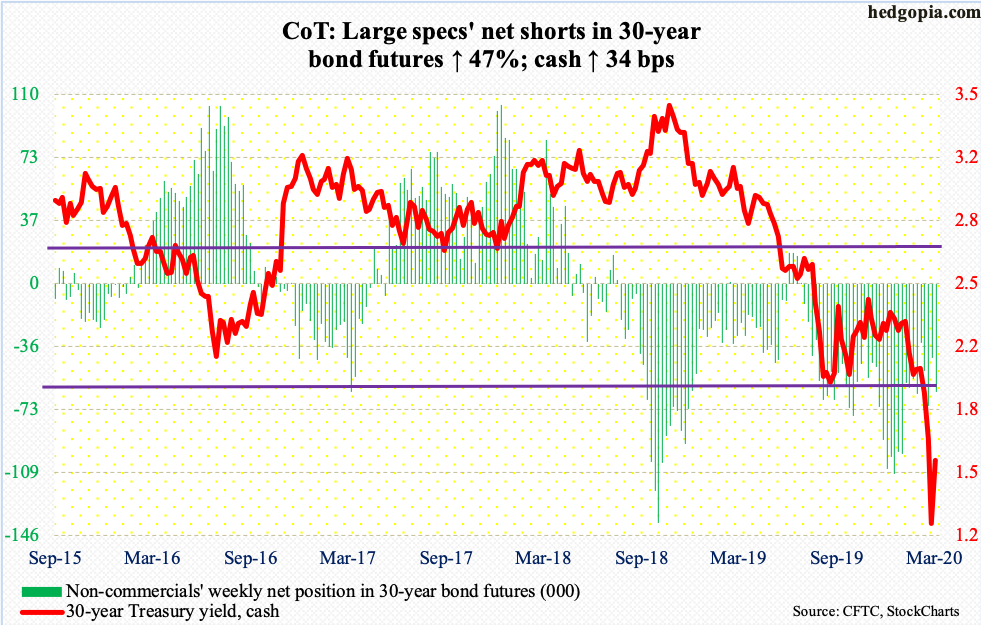
30-year bond: Currently net short 62.6k, up 20k. (TYX)
Major economic releases next week are as follows.
Treasury International Capital data (January) is due out Monday.In the 12 months to December, foreigners net-sold $3.5 billion in US stocks. This is massive improvement from net selling of $214.6 billion last April – a record.
Tuesday has on tap retail sales (February), industrial production (February), JOLTS job openings (January) and the NAHB housing market index (March).
January retail sales rose 4.4 percent year-over-year to a seasonally adjusted annual rate of $529.8 billion – a record. The last time sales dropped y/y was in October 2009.
Capacity utilization in January declined 2.8 percent y/y to 76.8 percent. This was the 10th straight y/y drop. Utilization this cycle peaked in November 2018 at 79.6 percent.
Non-farm job openings declined 364,000 month-over-month in December to 6.42 million. Openings have weakened quite a bit, with record high 7.63 million posted in November 2018.
Home builder optimism dropped a point m/m in February to 74. Last December’s 76 was the highest since June 1999.
Housing starts are due out Wednesday (February). In January, starts fell 3.6 percent m/m to 1.57 million units (SAAR).Last December’s 1.63 million was a 13-year high.
Existing home sales come out Friday (February). In January, sales dropped 1.3 percent m/m to 5.46 million units (SAAR). The cycle high 5.72 million was recorded in November 2017.
WTI crude oil: Currently net long 542.9k, down 24.6k. (OIL)
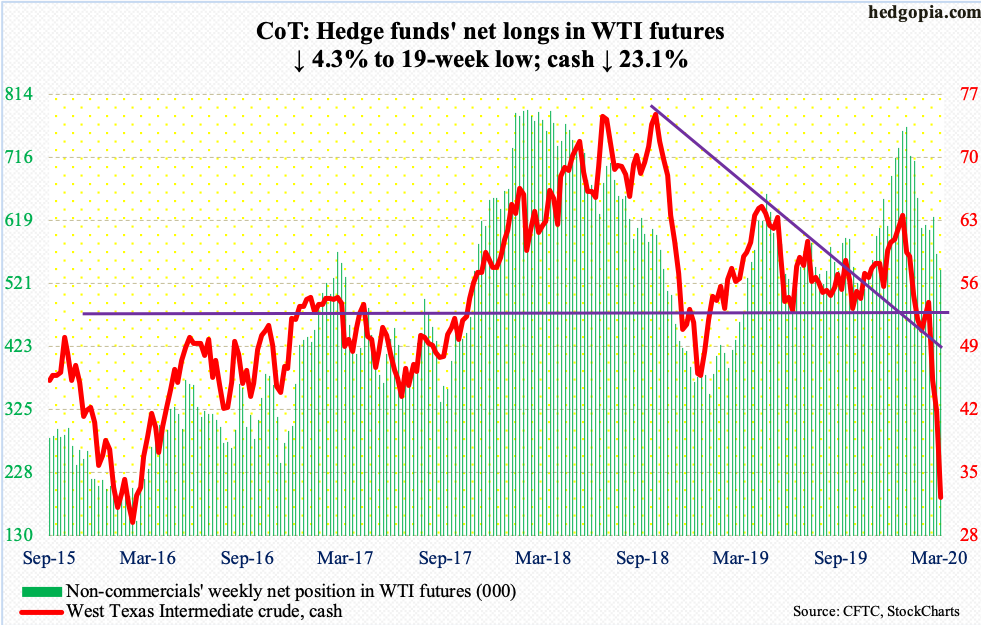
The February 2016 low of $26.05 was just about tested this week when the cash ($31.73/barrel) began the week with a gap-down tagging $27.34 intraday Monday. For the week, the crude collapsed 23.1 percent. Fundamentals are now catching up with broken-down technicals.
After failing to strike a deal last week to cut crude oil output, OPEC+ members have entered a no-holds-barred mindset. Russia refused to go along with an OPEC plan to curtail production. Following this, Saudi Arabia is increasing production, even as the coronavirus has sapped global demand. Russia plans to raise its own production. Price war has begun, as producers are offering discount rates to key buyers. Investors are wondering how all this would impact higher-cost producers such as US shale.
US crude production in the week to March 6 dropped 100,000 barrels a day from prior week’s record 13.1 million bp/d.The EIA report also showed stocks of both gasoline and distillates fell five million barrels and 6.4 million barrels respectively to 247 million barrels and 128.1 million barrels. Crude stocks, however, were up 7.7 million barrels to 451.8 million barrels. Crude imports, too, grew – up 174,000 b/d to 6.4 mb/d. Refinery utilization edged down five-tenths of a percentage point to 86.4 percent. (USO)
After Monday’s low, WTI has essentially gone sideways. The crude is oversold on multiple timeframes. Immediately ahead, there is resistance at $33.50s, and then $36.30s.
E-mini S&P 500: Currently net short 1.6k, up 6.8k. (SPY)
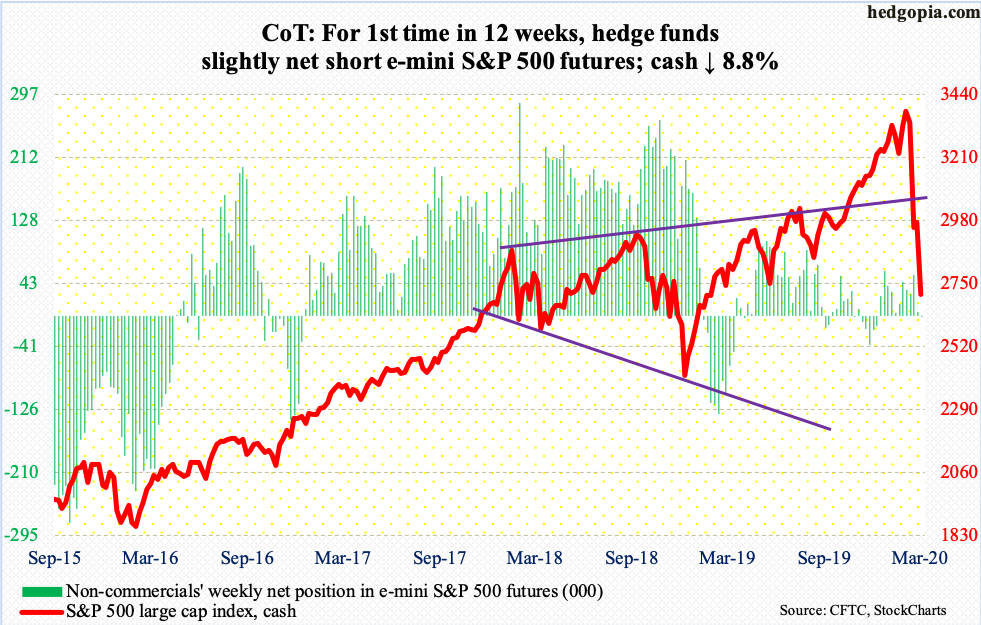
Thursday’s 9.5-percent collapse was the worst since Black Monday (October 1987). For the week, the cash (2711.02) dropped 8.8 percent; at one time Thursday, the S&P 500 index was down 16.6 percent. Friday produced a reversal candle, rallying 9.3 percent.
Several technical indicators are grossly oversold, and they need to unwind. Intraday, in 17 sessions through Thursday, the index crashed 27 percent. Only one percent of S&P 500 stocks were above their 50-day moving average in that session, with Friday at 3.81 percent. There is a long way to go on the upside.
Immediately ahead, resistance lies at 2850s, followed by the 200-day moving average at 3049.18
In the meantime, dry powder continues to accumulate. In the week to Wednesday, money-market assets surged $93.9 billion week-over-week to $3.78 trillion. In January 2009, assets peaked at $3.92 trillion before coming under sustained pressure. In the same week, US-based equity funds lost $4.2 billion (courtesy of Lipper), while SPY (SPDR S&P 500 ETF), VOO (Vanguard S&P 500 ETF) and IVV (iShares Core S&P 500 ETF) together gained $2.4 billion (courtesy of ETF.com).
Euro: Currently net short 12.7k, down 74k. (FXE)
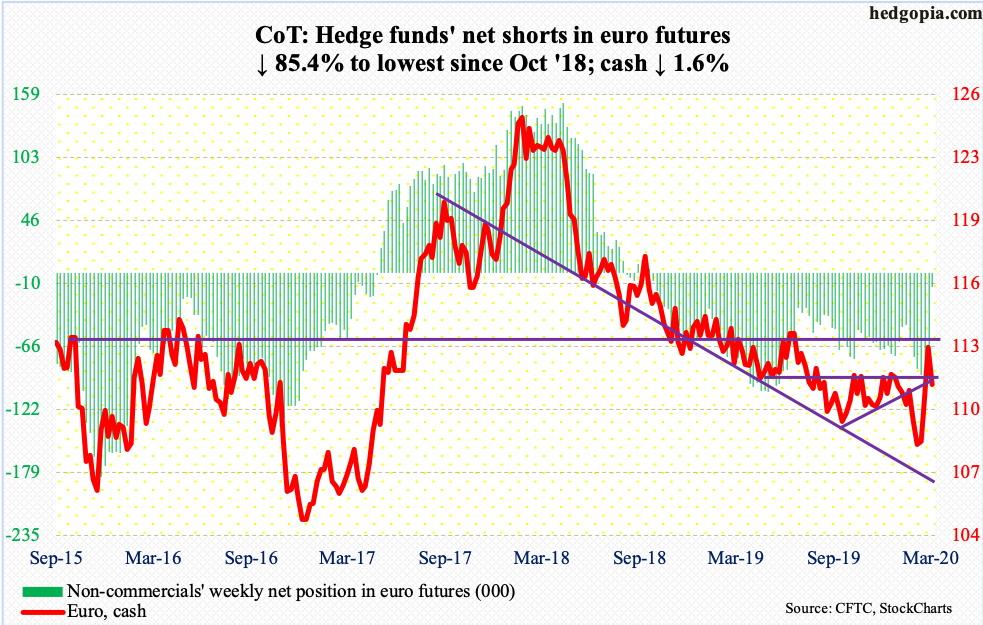
The week opened with continued momentum, but not before the cash ($111.25) closed Monday with a large spinning top candle. The intraday high of $114.85 in that session was rejected right at horizontal resistance at $115. As recently as February 20, the euro bottom-ticked $107.82, so has come a long way.
Both Thursday and Friday, the 50- and 200-day were defended – $110.53 and $111.07 respectively – but breach risks are rising.
Gold: Currently net long 299.5k, down 20.2k. (GLD)
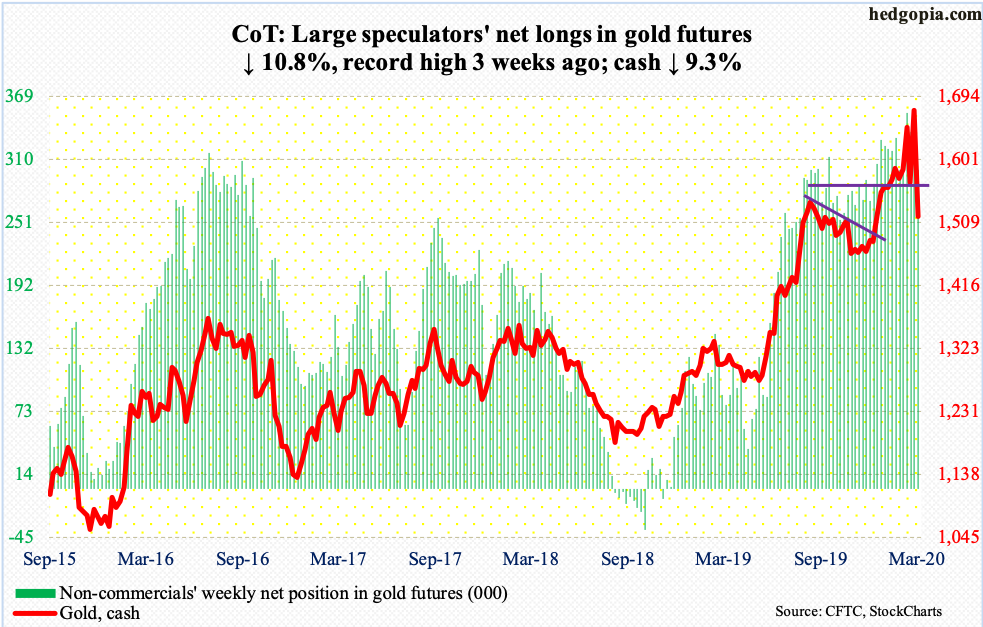
After failing the last two weeks, the cash ($1,516.70/ounce) continued to face resistance at $1,700 this week.Monday’s intraday high of $1,704.30 was sold quickly. This was followed by more selling in the remaining sessions. By Friday, the 50-day was gone, as did crucial support at $1,550s-60s.
Gold bugs’ inability to rally in the face of bloodbath in equities is likely a morale-booster for bears. They are now probably eyeing $1,440s, which was defended several times last November.
Several weekly indicators have turned lower. This can possibly lead to outflows from gold-Focused ETFs, which have benefited from inflows the past several weeks.In the week to Wednesday, IAU (iShares Gold Trust) gained $315 million and GLD (SPDR Gold ETF) $999 million (courtesy of ETF.com).
Non-commercials, too, can play a role here. They have amassed massive net longs in gold futures and can be tempted to lock in profit.
Nasdaq 100 index (mini): Currently net long 17.7k, down 14.5k. (COMP)
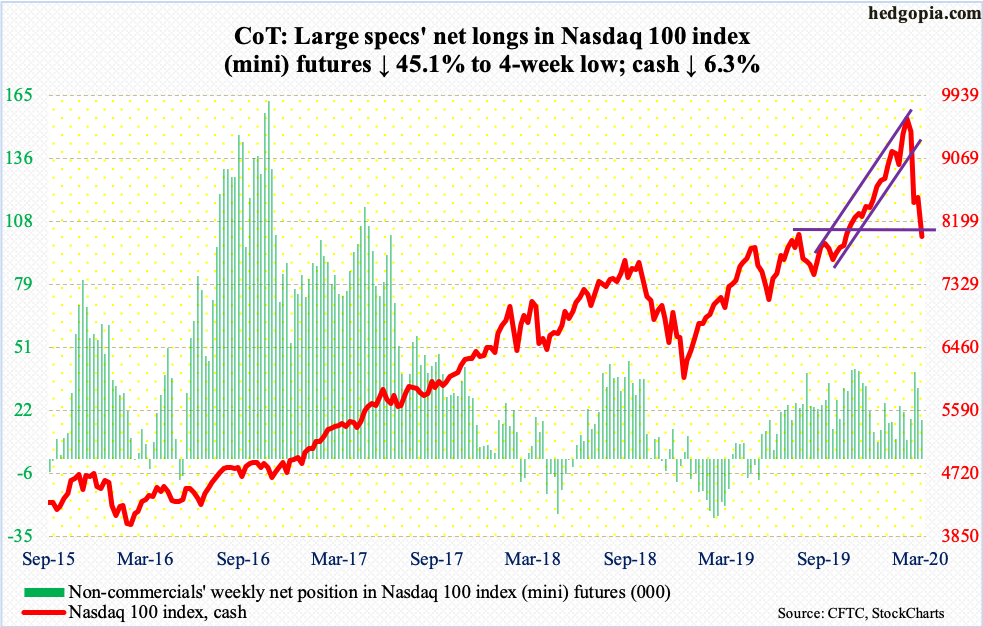
In the week through Wednesday, QQQ (Invesco QQQ Trust) lost $912 million (courtesy of ETF.com).
Support levels gave way one after another. Since peaking on February 19, the Nasdaq 100 dropped 25.5 percent intraday in merely 17 sessions. This obviously drove several indicators into gross oversold territory. Friday’s intraday reversal with a bullish hammer bodes well for tech bulls – at least near term.The 200-day is right above at 8185.96.
Russell 2000 mini-index: Currently net long 22k, down 1.2k. (IWM)
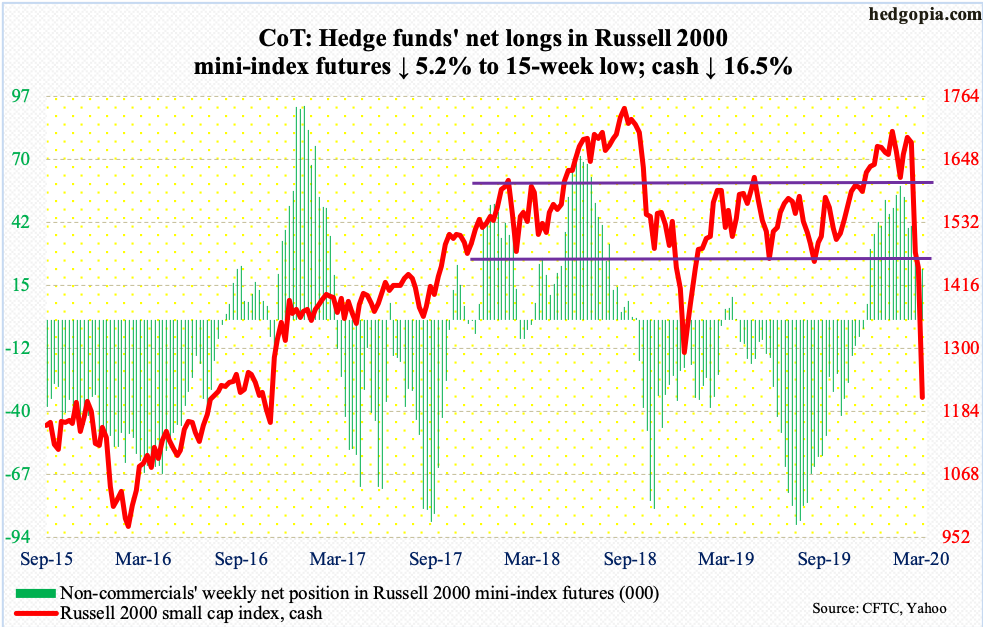
In 16 sessions through Thursday’s low, the cash (1210.13) collapsed 34 percent.After losing 1600+ late February, the Russell 2000 this week bed adieu to 1450s, on its way to undercutting the low of December 2018 at 1266.92, which likely becomes a new battleground for bulls and bears.
Even including Friday’s 7.8-percent rally, the index collapsed 16.5 percent this week – much worse than its large-cap peers. Small-caps need to begin to outperform for signs of return of risk-on sentiment.
US Dollar Index: Currently net long 12.4k, down 10.1k. (UUP)
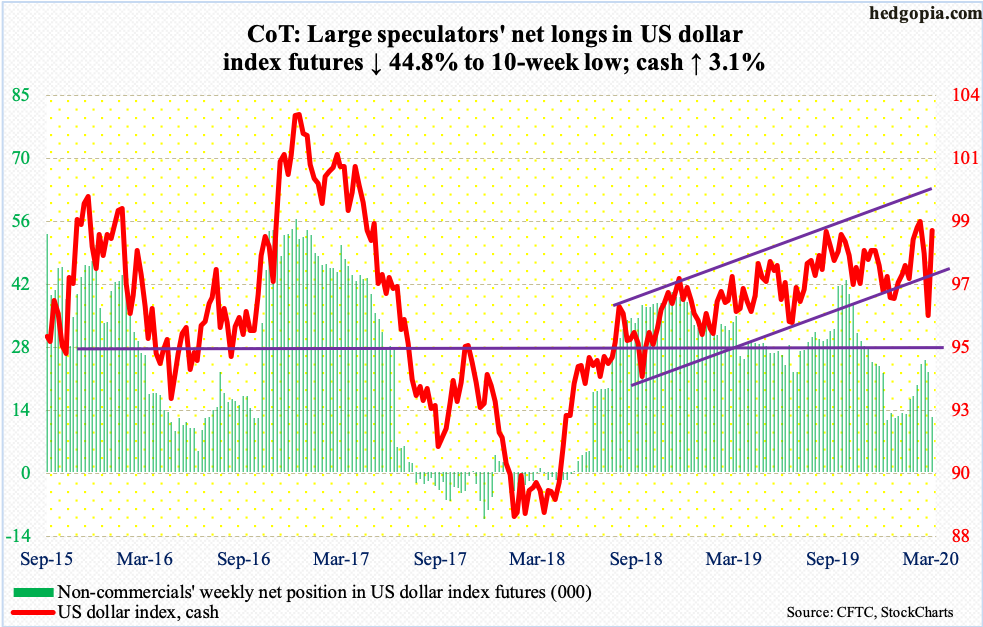
Monday’s intraday low of 94.61 undercut the low of January 2019 by 0.03 before bids showed up. The cash (98.90) rallied strongly in the remainder of the week.
The US dollar index has rallied back into an ascending channel from August/September 2018.The upper bound lies around 100.
VIX: Currently net short 63.3k, up 5.8k. (VIX)
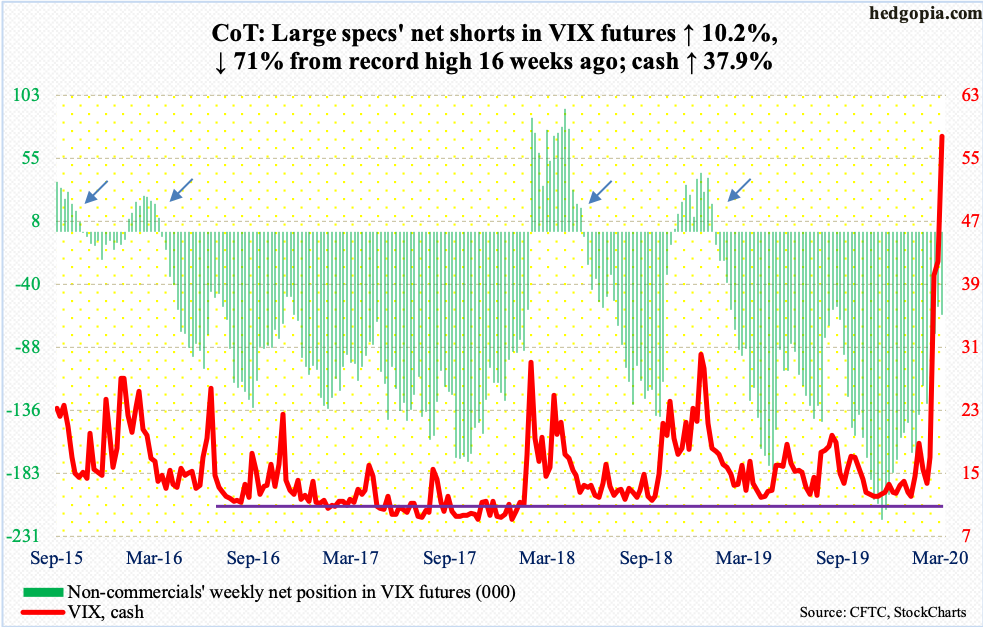
Friday, the cash (57.83) printed 77.57 intraday. The only time VIX traded higher was in October/November 2008 – in the throes of the financial crisis. Back then, the volatility index top-ticked 89.53.Such surges in due course give way to a sustained drop in volatility.
Elsewhere in the options market, the 21-day moving average of the CBOE equity-only put-to-call ratio ended the week at 0.769, which reflects the prevailing fear in the markets (more on this here). As this gets unwound, equities should get a tailwind.


