
Peek Into Future Through Futures; How Hedge Funds Are Positioned
Following futures positions of non-commercials are as of November 26, 2019 (data was published Monday instead of last Friday due to Thanksgiving holiday).
10-year note: Currently net short 145.7k, down 37.8k.
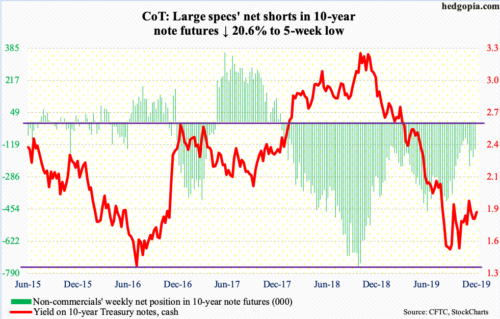
In the last nine weeks, the Federal Reserve’s SOMA (System Open Market Account) holdings increased from $3.55 trillion to $3.65 trillion, up $96.6 billion. This preceded a $688-billion reduction from the April 2017 high of $4.24 trillion. Pre-financial crisis, these holdings were sub-$500 billion, meaning even after the two-and-a-half-year decline, the Fed holds a massive arsenal of Treasury and mortgage-backed securities.
This is noteworthy particularly because the bank has been unable – or unwilling – to significantly cut its balance sheet during a time when the economy is in expansion. There will be a downturn. It is just a matter of when, not if, which also suggests the balance sheet’s path of least resistance, in the long run, is up.
For whatever it is worth, the latest bottom in SOMA holdings took place in the week ended September 25. Stocks bottomed early October.
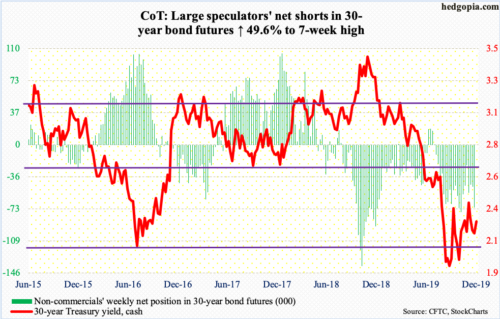
30-year bond: Currently net short 71.4k, up 23.7k.
Major economic releases for the remainder of this week are as follows.
Wednesday brings the ISM non-manufacturing index (November). Services activity in October increased 2.1 points month-over-month to 54.7.
Revised durable goods data (October) are due out Thursday. Preliminarily, orders for non-defense capital goods ex-aircraft – proxy for business capex plans – fell 0.8 percent year-over-year to a seasonally adjusted annual rate of $69.4 billion. This was the fourth y/y decline in a row.
The employment report (November) and the University of Michigan’s consumer sentiment index (December, preliminary) are scheduled for Friday.
October produced 128,000 non-farm jobs – a five-month low – for a monthly average this year of 167,000, versus a monthly average last year of 223,000 jobs.
Consumer sentiment firmed up 1.3 points m/m in November to 96.8. Except for August’s 89.8, sentiment has been north of 90 since November 2016, four of which were 100 or higher.
WTI crude oil: Currently net long 653k, up 45.2k.
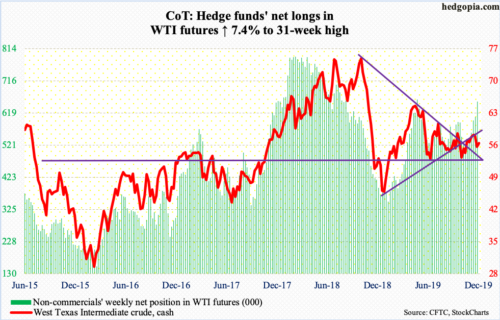
In the week to November 22, US crude production increased 100,000 barrels per day to 12.9 million bpd – yet another record. Stocks of crude, gasoline and distillates all rose – up 1.6 million barrels, 5.1 million barrels and 725,000 barrels to 452 million barrels, 226 million barrels and 116.4 million barrels, in that order. Crude imports grew as well – up 218,000 bpd to 6.2 mbpd. Refinery utilization edged down two-tenths of a percentage point to 89.3 percent.
Bulls did not have much to hang their hat on in the EIA report. Last Friday, the cash ($55.96/barrel) collapsed 5.1 percent, slicing through both the 200- and 50-day moving averages ($57.52 and $55.58, respectively), although the latter was reclaimed Monday. Several weekly indicators seem to be itching to turn down from just above the median. The weekly can continue lower. Worse, bulls may once again have to defend horizontal support at $50-51, which they successfully defended early October.
E-mini S&P 500: Currently net short 16.8k, up 8.4k.
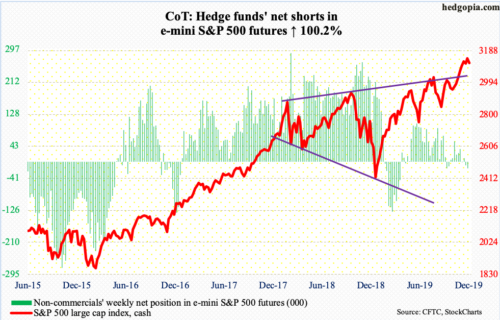
The cash (3113.87) rallied one percent last week – seventh up week in eight. It has nearly gone parabolic since bottoming early October, rallying more than 10 percent through last Wednesday’s all-time high of 3154.26.
Bulls did a good job of building on a break five weeks ago out of 3020s. Bears would at least want a retest of that breakout, which is three percent away. The latter may have an opening here. Monday’s 0.9-percent drop in the S&P 500 cost the former the 10-day, although the 20-day is still intact. Last time there was a cross-under was early October.
For most of the second half last month, the daily RSI stayed north of 70. It closed on Monday at 58.13. It is hard to sustain above 70 for too long.
Euro: Currently net short 61.4k, down 1.1k.
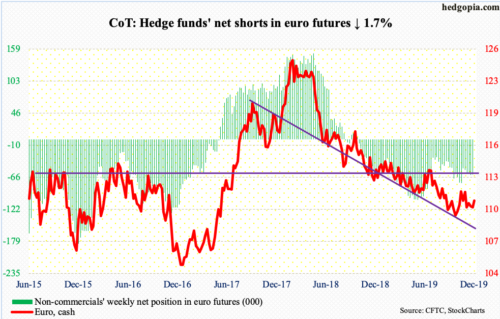
Last Friday’s intraday low of $109.81 came pretty close to testing the daily lower Bollinger band. That low also just about tested horizontal support at $110. The cash ($110.83) took care of the 50-day ($110.42) Monday and has room to head higher. The 200-day is at $111.70.
Gold: Currently net long 271.6k, down 14.2k.
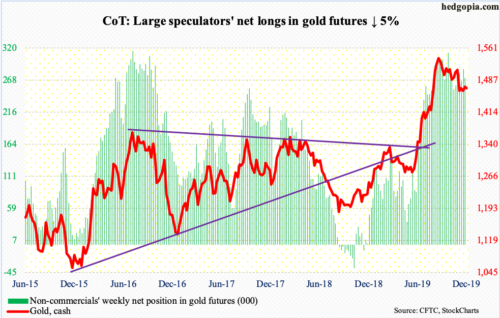
Once again, support at $1,440s-50s held. The cash ($1,469.20/ounce) last Tuesday dropped to $1,449.60 where bids showed up. Earlier on November 12, gold made an intraday low of $1,446.20. The metal broke out of this price zone early August.
Gold bugs should find the latest action encouraging. Amidst this, the 10-day has now gone flat. The 50-day is at $1,489.43, which also approximates trend-line resistance from September 4 when gold peaked at $1,566.20. A breakout at least opens the door to a test of $1,520s.
Nasdaq 100 index (mini): Currently net long 33.3k, down 1.3k.
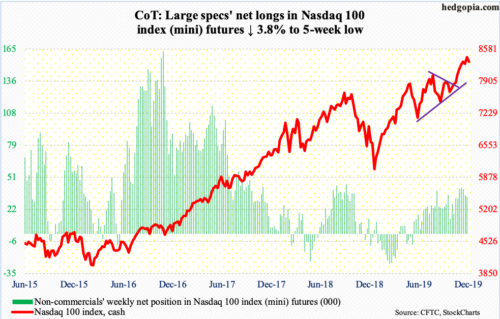
The cash (8309.26) further pulled away from its just-north-of-8000 breakout five weeks ago. It posted a new all-time high of 8445.61 last Wednesday. Conditions are stretched, but momentum is yet to break in earnest. In the prior week, bulls showed up at/near the 20-day for three straight sessions that laid the foundation for last week’s 1.6-percent rally. Risks are growing of a breach. The average was once again tested Monday, even as the 10-day was lost. A cross-under needs to develop for bears to begin to get traction.
Russell 2000 mini-index: Currently net long 6.8k, up 10.6k.
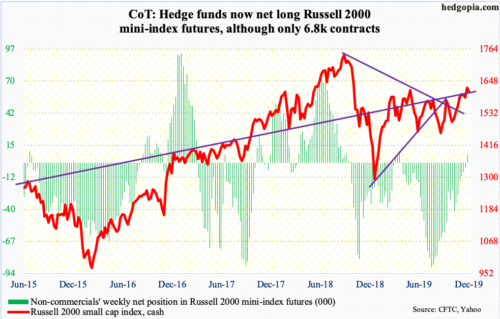
Resistance just north of 1600 on the cash had been in place since January last year. After bottoming late last year, the Russell 2000 rallied, but only to hit that roadblock in February. Since then, four more breakout attempts were denied – until last week.
The latest rally began early October when small-cap bulls defended horizontal support at 1450s. If last week’s breakout is genuine, range-breakout traders could be eyeing to test the all-time high from August last year when the index (1607.58) peaked at 1742.09.
Real test lies in what transpires when a retest of that breakout takes place. Conditions remain overbought. Monday’s one-percent drop essentially puts the index at that crucial support.
US Dollar Index: Currently net long 24.1k, down 487.
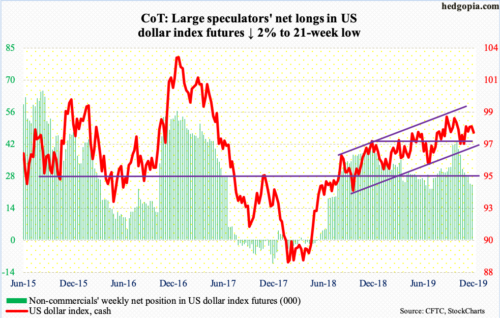
A doji formed on the weekly last week. Friday’s intraday high of 98.50 would have established a higher high versus 98.30 from November 13 but bulls were unable to seal it by close. The cash (97.79) was denied at a falling trend line from September 3 when the US dollar index retreated after tagging 99.33. The 50-day was lost Monday. Bulls need to save 97.50s.
VIX: Currently net short 210.7k, down 7.7k.
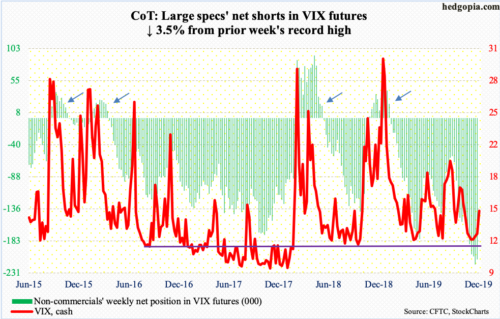
The cash (14.91) last Tuesday tagged 11.42 intraday, which was a seven-month low. By the end of the week, a weekly hammer developed. This preceded a weekly gravestone doji. The latter more often than not is found at the end of an uptrend but can be found at the end of a downtrend as well. Volatility bulls hope it is the latter. Volatility remains suppressed and has been that way for a while now. On October 2, VIX tagged 21.46. Monday’s 18.2-percent spike was enough to reclaim the 50-day but not the 200-day (15.10).
For the first time in seven weeks, non-commercials reduced their holdings of net shorts in VIX futures. The prior week was a record high. If the cash has indeed bottomed, it is possible these traders end up becoming a tailwind. Historically, VIX does not peak until non-commercials are either net long or have substantially cut back their net shorts.
In the meantime, the 21-day moving average of the CBOE equity-only put-to-call ratio reached 0.572 on November 22. This was the lowest since July last year. It closed Monday at 0.577. Historically, the ratio tends to bottom at high 0.50s to low 0.60s. Once the process of unwinding this optimism begins, stocks come under pressure.


