
Peek Into Future Through Futures, How Hedge Funds Are Positioned - Tuesday, Dec. 31
Following futures positions of non-commercials are as of December 24, 2019 (data was published Monday instead of last Friday due to Christmas holiday).
10-year note: Currently net short 268.7k, up 23.3k.
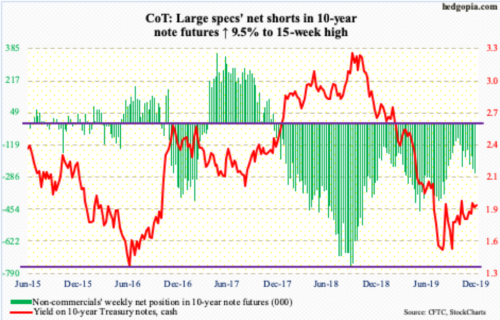
Last Tuesday’s intraday high of 1.95 percent was yet another instance in the last month and a half bond bears (on price) were denied just shy of two percent.
On November 7, the 10-year T-yield (1.9 percent) retreated after tagging 1.97 percent intraday. Before that, on September 13, rates touched 1.9 percent; all this, of course, preceded a bottom early that month when the 10-year bottomed at 1.43 percent, which just about matched the July 2012 low of 1.39 percent and the low four years after that of 1.34 percent.
But breaking through the 1.95 percent barrier has proven tough. Even if this roadblock is taken care of, the 200-day moving average (two percent) lies right above. For now, odds favor rates go lower. A rising trend line from the September bottom gets tested just above 1.7 percent. Before that, there is the 50-day at 1.83 percent.
Should things evolve this way – at least near term – S&P 500 companies will continue to wield yield advantage over 10-year notes (more on this here). Non-commercials, who are heavily net short these notes, however, will not be thrilled, as this goes against their bearish positioning.
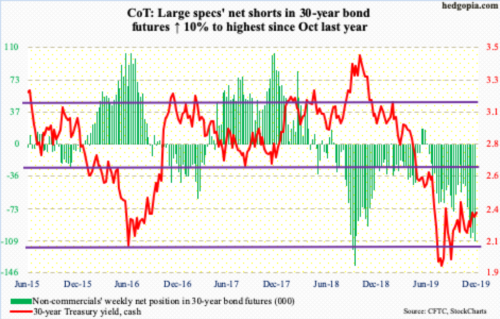
30-year bond: Currently net short 110.1k, up 10k.
Major economic releases for the rest of this week are as follows. Happy New Year!
The S&P Case-Shiller home price index (October) is due out later this morning. Nationally, home prices rose 3.2 percent year-over-year in September. This is an improvement from August’s 3.1 percent appreciation but softer than the 6.5 percent pace seen in March 2018.
Friday brings the ISM manufacturing index (December). Manufacturing activity edged down two-tenths of a point month-over-month in November to 48.1. This was the fourth consecutive month of sub-50 reading. Orders activity, too, languished under 50 the last four months.
WTI crude oil: Currently net long 732.5k, up 16.2k.
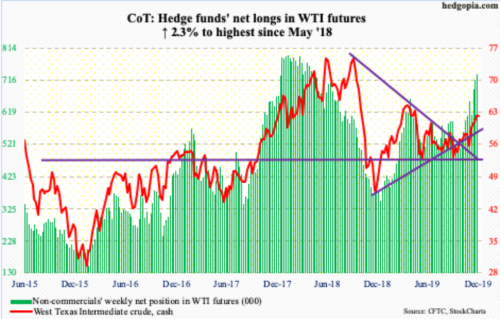
Last week’s 2.1-percent jump was the fourth positive week in a row the cash ($61.68/barrel) strung together. With one session to go, December has been very good, up 11.8 percent. Conditions are overbought, but bulls have not quite lost the momentum – not yet anyway. The crude has remained above the 10-day from early this month.
At the same time, several monthly indicators have reached the median. This is an area where a bull-bear duel is likely. Signs of indecision are showing up, with a daily long-legged doji last Friday as well as this Monday. Nearest support lies at $59.
E-mini S&P 500: Currently net long 27.1k, up 40.6k.
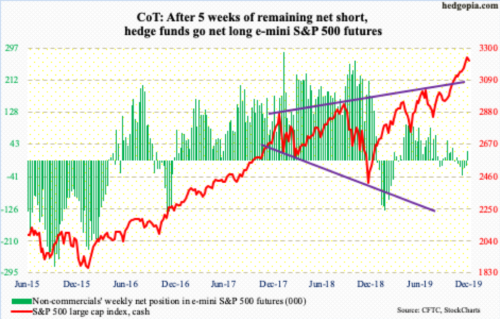
In a low-volume, seasonally favorable week, the cash (3221.29) rallied another 0.6 percent last week – fourth straight up week and 11th out of the last 12. From early October through last Friday’s high, the S&P 500 large-cap index rallied 12.5 percent. For the year, it is up 28.5 percent! Not bad for a year in which operating earnings are slated to grow just north of four percent. That is, assuming Q4 estimates of $40.20 come through. Once again, going into the reporting season, estimates have been lowered. When the quarter began in October, the sell-side expected $42.17. The hurdle customarily is low.
But this also comes amidst persistently overbought conditions. Last week, the daily RSI hit 79. Monday, it dropped to a hair below 69. There is a lot of unwinding left in this indicator, and several others. Sellers overwhelmed buyers Monday. Rather predictably, bulls stepped up in defense of the 10-day. Breach risks are rising. The next test is the 20-day at 3174, followed by horizontal support at 3150s.
Euro: Currently net short 72.9k, up 7.2k.
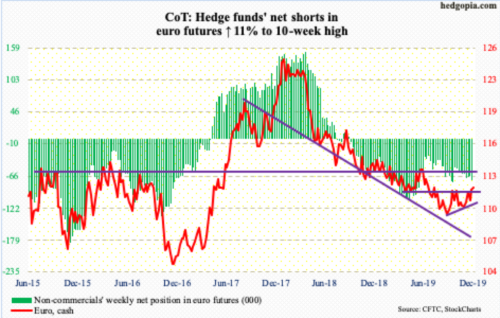
Euro bulls were finally able to bust through resistance at $111.80s. Early November, the cash ($112.04) retreated after tagging $111.82 intraday. This month, bulls went after that level several times but to no avail. Last Friday, the euro gapped up to post an intraday high of $111.89 but only to close at $111.75. Come Monday, the ceiling cracked, although bulls were unable to hang on to all the daily gains. If the move is genuine, they should be able to defend the resistance-turned-support.
Gold: Currently net long 305.7k, up 19.4k.
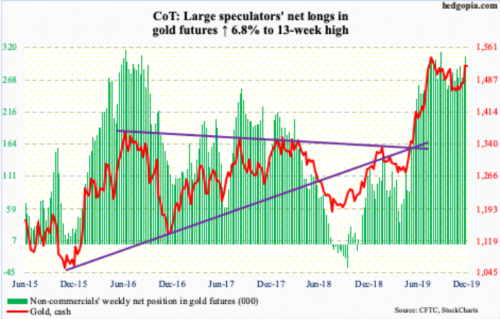
Early last week, the cash ($1,518.60/ounce) broke through a falling trend line from early September when the metal peaked at $1,566.20. Gold lingered around this resistance for several sessions before the breakout occurred. This preceded defense of $1,440s-50s last month. The 50-day ($1,482.19), which approximated the resistance in question, has been taken out as well. Once $1,520s falls, gold bugs should be eyeing $1,540s and the September high after that.
In the event the metal proceeds to unwind overbought daily conditions, decent support lies at $1,480s.
Nasdaq 100 index (mini): Currently net long 13.5k, up 5.6k.
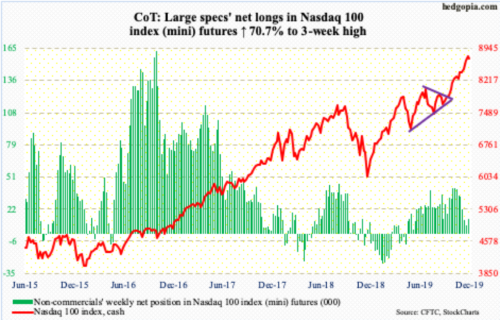
Last Friday, after rallying for 11 straight sessions, the cash (8709.73) rose to a new high of 8811.10 intraday but only to slightly reverse and close down 0.1 percent. Thursday, the daily RSI hit 80-plus, which is well into the extended territory. For now, bulls will no doubt try to hold on to the momentum ball as long as possible.
Into Monday’s trading, the Nasdaq 100 in the past several sessions rallied all along the daily upper Bollinger band. Bears first need to force the 10- and 20-day to at least flatten out. Monday, the former was tested and held. The next line of support lies at 8450s. Monday, the daily RSI dropped to 70.60. Typically, a drop under 70 begins a process of unwinding.
Russell 2000 mini-index: Currently net long 40.7k, down 1.9k.
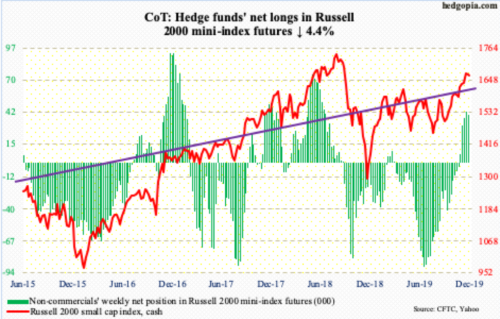
Last Friday produced an outside day on the cash (1664.15). This is a potentially reversal candle but needs confirmation. The 10-day (1667.12) has been lost, albeit slightly. The last time the Russell 2000 was below this average was early this month.
The index has rallied massively since bottoming early October – up 15 percent through Friday’s high. It is too soon to say if Friday’s candle is the opening small-cap bears have been looking for but deserves a close watch.
US Dollar Index: Currently net long 13.2k, up 1.5k.
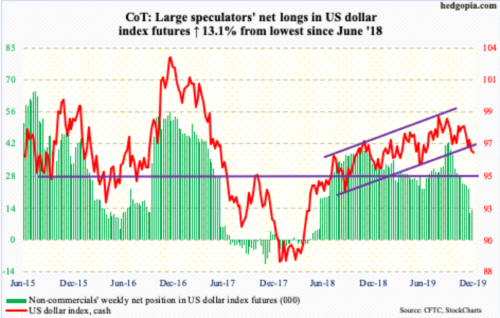
The 50- and 200-day are on the verge of a death cross – for whatever it is worth. Both Monday and Tuesday last week, the 200-day (97.41) rejected rally attempts. The cash (96.41) is at risk of losing a rising trend line from September last year. Downward momentum can build should that happen, particularly if the US dollar index slices through the intraday low of 96.30 from the 13th this month; Monday, this level was tested but held.
VIX: Currently net short 156.6k, down 16.8k.
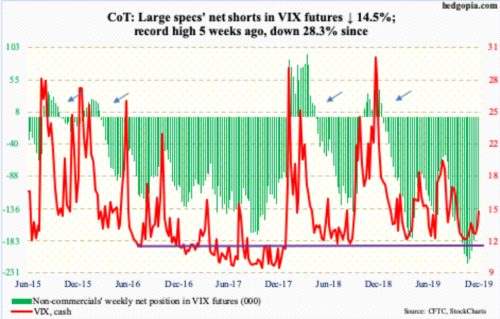
Both Thursday and Friday last week, the cash (14.82) was pushed under 12 intraday but managed to close well above that support, particularly on Friday when VIX retook the 50-day (13.21). The average has now gone flat and, hopefully, for volatility bulls, Friday’s action is a precursor to it turning up.
In this scenario, 16.50 is worth a close watch. This is where a falling trend line from early August lies and has provided stiff resistance several times already, resulting in a pattern of lower highs.


