
Peek Into Future Through Futures, How Hedge Funds Are Positioned - Tuesday, Dec. 29
Following futures positions of non-commercials are as of December 22, 2020 (data was made public this Monday instead of last Friday due to the Christmas holiday).
10-year note: Currently net long 50.2k, up 22.8k.
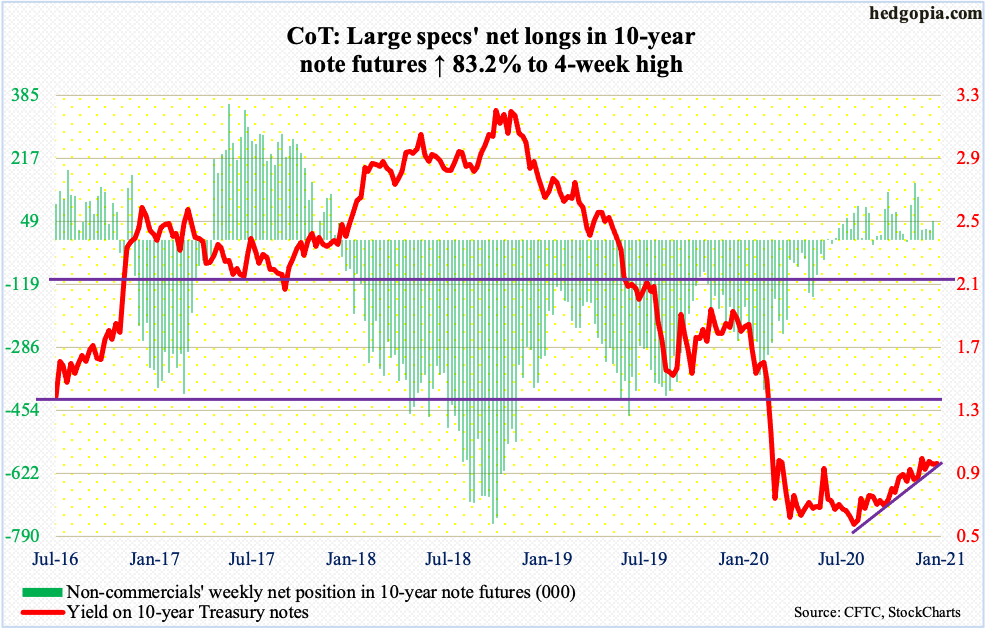
Once again last week, bond bears (on price) were rejected just under one percent. Last Wednesday’s intraday high of 0.97 percent was one of several unsuccessful attempts since June to rally the 10-year yield past one percent. Rates have not been over that threshold since March. The closest was on the 4th this month when these notes yielded 0.99 percent before reversing lower.
On a weekly, rates are extended. Early August, the 10-year only yielded 0.5 percent. Plus, the Fed remains an active buyer of treasury securities, which helps exert downward pressure on these yields. The bears do have one thing going for them, which is technicals. Since the August low in particular and even going back to March, the 10-year has made higher lows. The ascending triangle pattern can eventually result in a breakout.
Should things evolve this way, more interesting would be the Fed’s reaction function. It has already guided to monthly purchases of at least $120 billion in US treasury bonds and mortgage-backed securities. In a highly leveraged economy – be it federal, corporate, or household – higher rates can begin to bite a lot quicker. With the balance sheet already $7.4 trillion, the central bank will have a juggling act in hand.
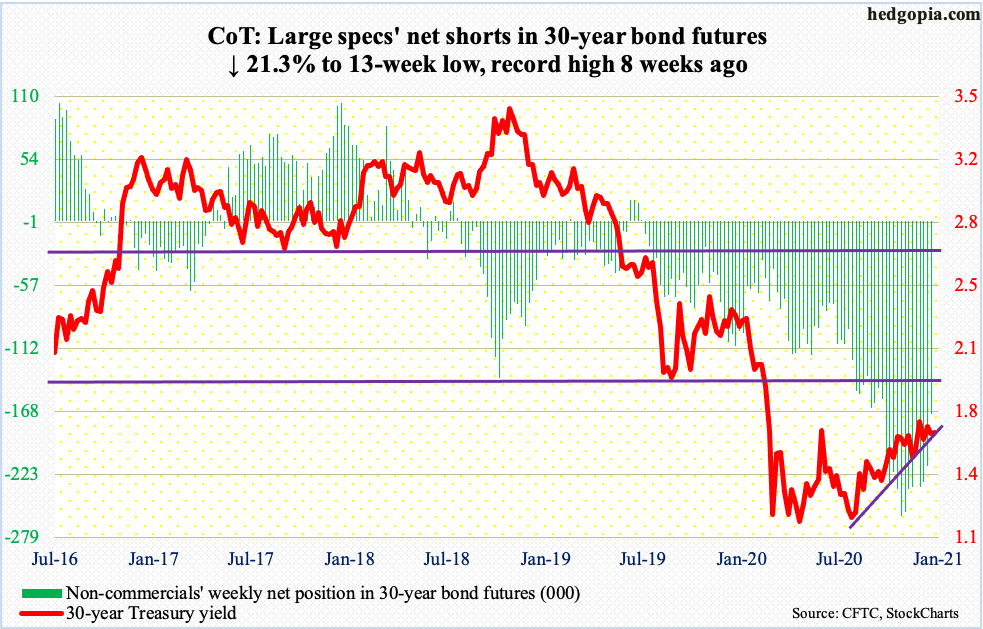
30-year bond: Currently net short 170.4k, down 46k.
Major economic releases for the remainder of the week are as follows. Happy New Year!
The S&P Case-Shiller home price index (October) is published later this morning. Nationally, US home prices jumped seven percent year-over-year in September. This was the fastest y/y pace since May 2014. Price appreciation has accelerated since bottoming at 3.1 percent in August last year.
WTI crude oil: Currently net long 551.9k, up 959.
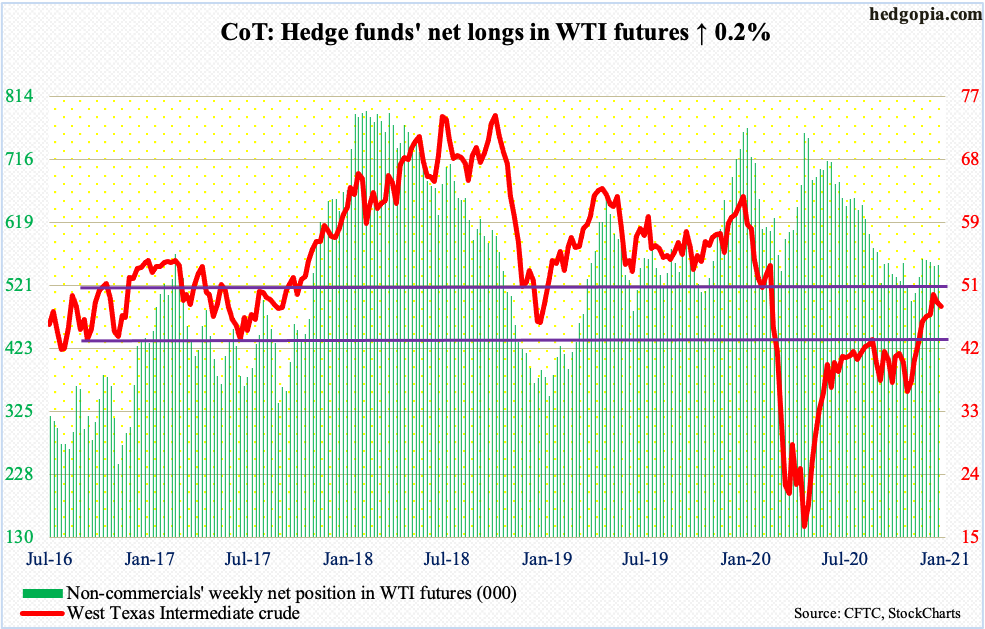
The intraday high of $49.43 six sessions ago stands. In the next three sessions after that high, WTI ($47.62/barrel) successfully tested the 20-day moving average but is also struggling to save the 10-day. There is short-term straight-line support at $46.
Five weeks ago, the crude broke out of crucial resistance at $42-$43. Even earlier, on November 3, it bottomed at $33.64 before going straight up. Last week, WTI gave back 2.1 percent, but before that, it rallied for seven straight weeks. There is major horizontal resistance at $49-$50. Unless this gets taken out, the risk is to the downside – if nothing else just to unwind overbought conditions.
E-mini S&P 500: Currently net short 24.6k, down 10.1k.
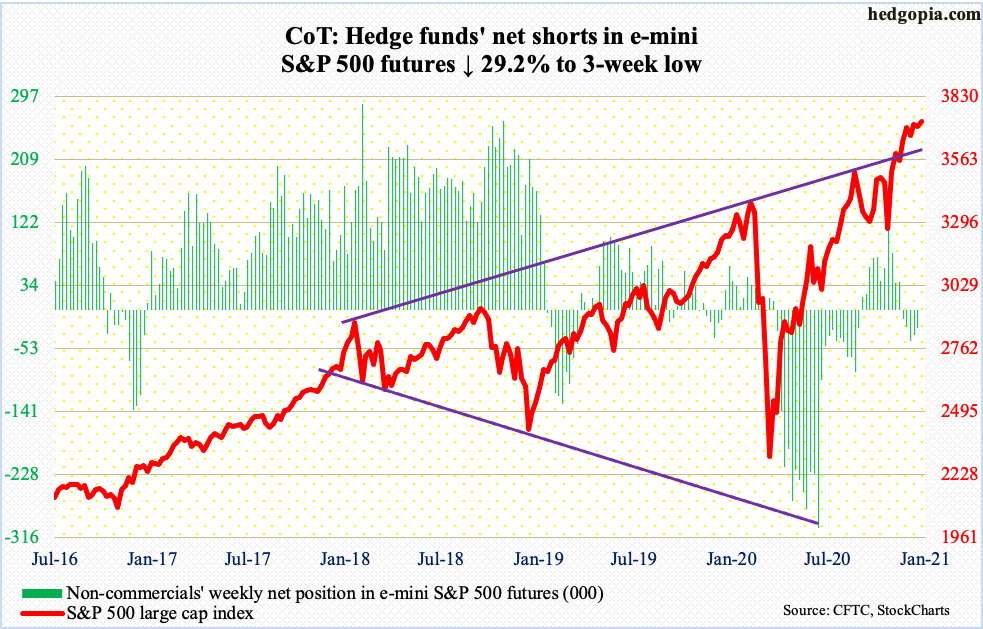
Bulls continue to step up in defense of 3640s. On November 9 when Pfizer (PFE) announced positive vaccine news, the S&P 500 rallied to a new intraday high of 3645.99 but only to reverse hard and end the session at 3550.50. Bulls since have used this level as an opportunity to go long, including Monday last week. Despite signs of lethargy of late, with the 10- and 20-day flattish, as long as 3640s is intact, bulls hold the momentum card. After this comes 3580s, which is where the large-cap index peaked on September 2.
Noticeably, in a sign of a meaningful increase in the willingness to lever up, from March when the S&P 500 (3735.36) bottomed at 2191.86, FINRA margin debt is up 50.7 percent. In November, it rose $62.8 billion month-over-month to $722.1 billion – a new high (chart here). At least vis a vis disposable personal income, it is dangerously close to a reversal. In November, margin debt made up 4.18 percent, which was the highest since 4.26 percent in May 2018. In January that year, the metric reversed lower after hitting 4.33 percent; the S&P 500 fell in both February and March. Historically, readings north of four percent are hard to sustain (more on this here).
Euro: Currently net long 143.9k, up 2.1k.
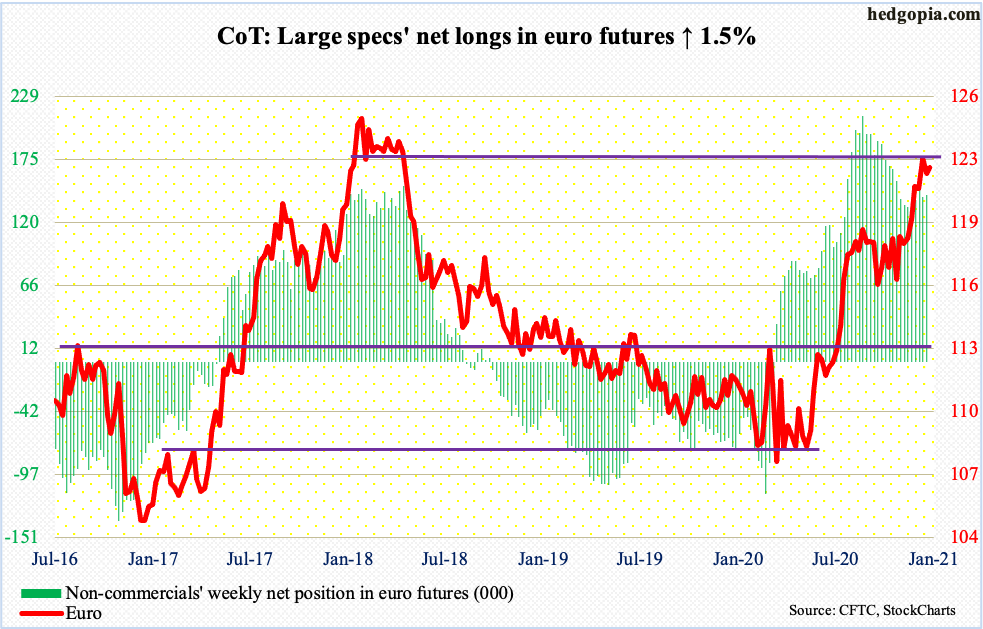
On December 17, euro bulls managed to rally past resistance at $1.21-$1.22 posting $1.2274 intraday, but staying there proved difficult. Throughout last week, as well as Monday this week, they were forced to defend the 10-day. A loss of $1.2170s raises the odds the $1.19-$1.20 breakout late November gets retested. This has been an important price point going back to May 2003. This is where the 50-day ($1.1945) lies as well.
The euro ($1.2215) has come a long way. In March, it languished at $1.0635. Conditions are getting overbought. The aforementioned breakout retest will be significant.
Gold: Currently net long 278.2k, up 6.6k.
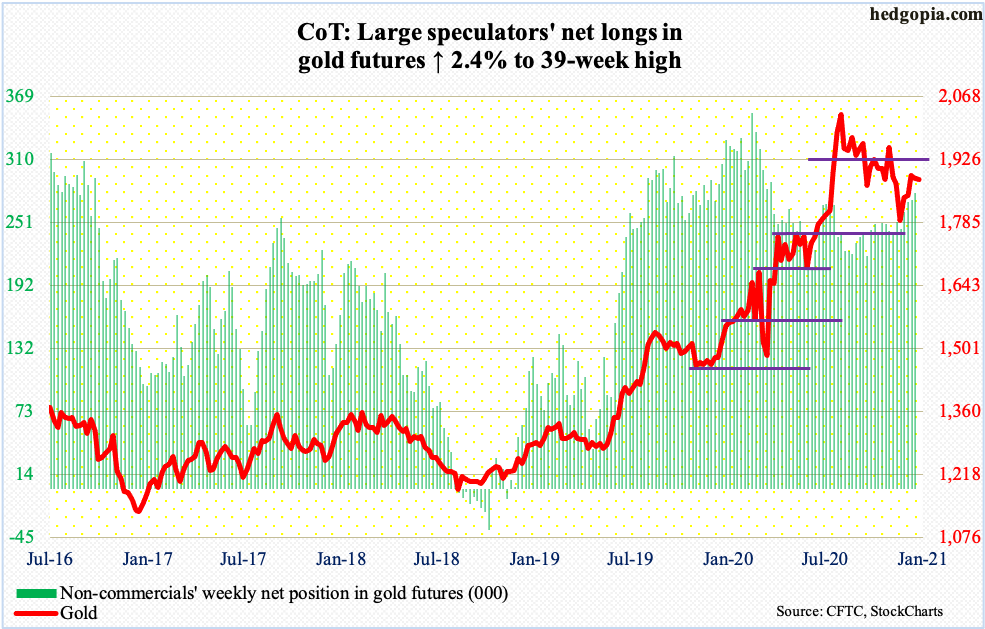
On Monday last week, $1,920s was not quite tested but it came close. Gold ($1,880.40/ounce) posted an intraday high of $1,912 in that session before reversing sharply lower. This level holds special significance in that this is where the metal peaked in September 2011.
After bottoming at $1,450.90 intraday in March, gold went on to surpass $1,920s in July this year, subsequently reaching $2,089.20 on August 7. Since that record high, gold bugs have struggled to recapture $1,920s even as they have managed to defend $1,850s, including Monday last week.
So, the grind continues. As things stand, a falling trend line from the August high gets tested at $1,900. Bulls will have to clear this hurdle before attempting to reclaim $1,920s.
Amidst this, non-commercials have raised net longs in gold futures to a 39-week high.
Nasdaq 100 index (mini): Currently net long 31.2k, up 19.2k.
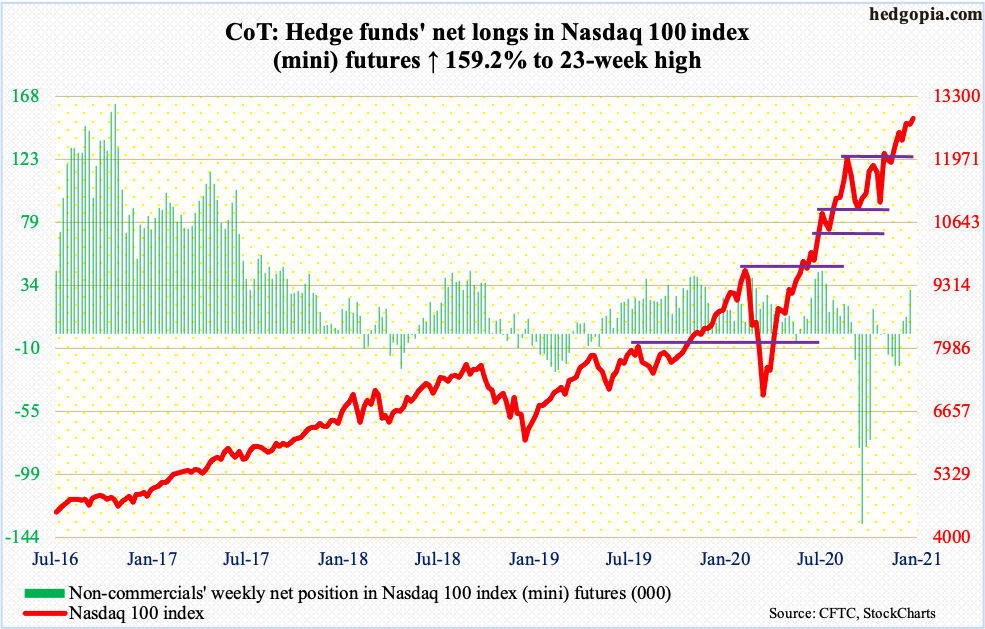
On September 2, the Nasdaq 100 retreated after posting an intraday high of 12439.48. On Monday last week, bids showed up just above this level, which at the time also approximated the 20-day. One session before that, the index (12838.86) tagged a new intraday high of 12793.47 but bulls were unable to hang on to the gains, in the end producing a potentially bearish hanging man. From their perspective, the good thing is that the pattern did not complete.
This Monday, in a low-volume session indicating a lack of sellers more than an abundance of enthusiastic buyers, the index went on to post a new intraday high of 12861.91. Nearest support lies at 12650s.
Russell 2000 mini-index: Currently net long 16.8k, up 993.
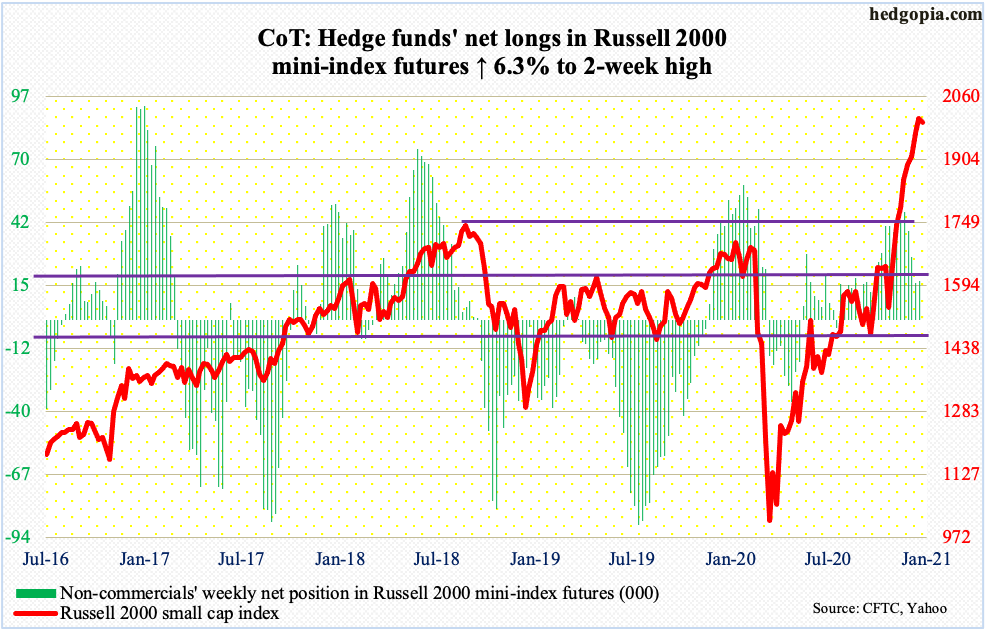
The energizer bunny that the Russell 2000 has become keeps marching on. Having more than doubled since March, the small-cap index has particularly gone ballistic since bottoming at 1530s late October/early November, although the move has come in a classic stair-step fashion.
Along the way, 1600-plus fell first, in early November. This has been an important price level since January 2018. Then, in the middle of last month, fell 1740s, which is where the Russell 2000 peaked back in August that year.
Investors have gravitated toward the sector in the wake of the November 3 presidential election and particularly after PFE and Moderna (MRNA) delivered positive vaccine news. Last Wednesday, the Russell 2000 was 34.7 percent from its 200-day – a new record. Conditions are way overbought. It increasingly feels like the trade is getting crowded – but no sign of major distribution just yet. Although bulls on Monday were probably not happy with the way the index rallied to a new intraday all-time high of 2026.24 but only to close 0.4 percent lower to 1996.25. The nearest support lies in 1920s, which approximate the 20-day.
US Dollar Index: Currently net short 14.9k, up 819.
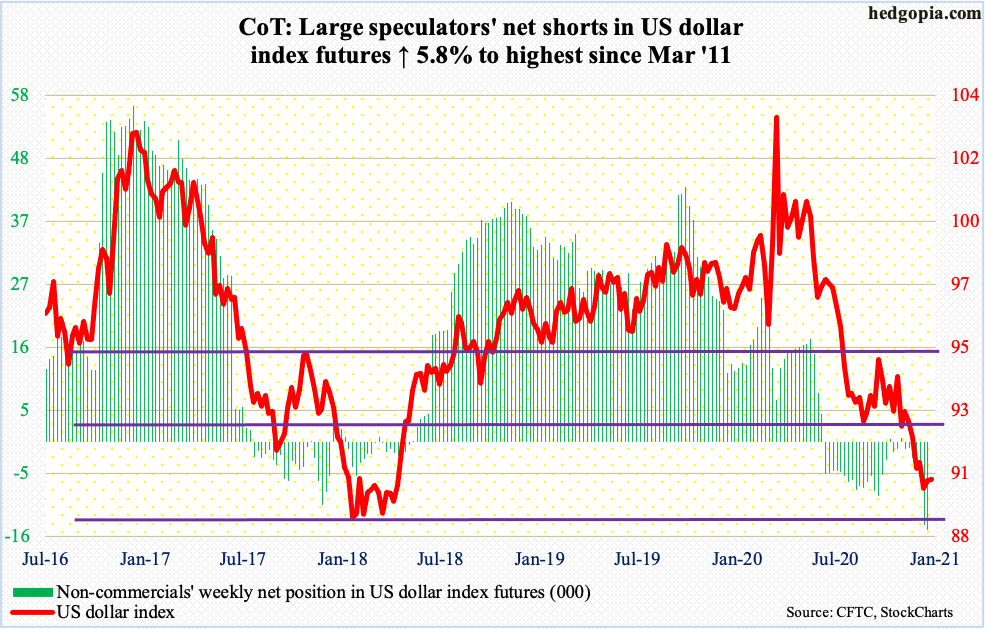
Horizontal support at 88-89 was just about tested seven sessions ago when the US dollar index (90.28) made an intraday low of 89.64. This was the lowest print since April 2018. In January through April that year, the index dropped to just north of 88 several times; this support goes back to at least March 2004.
On Monday last week, the index had a wild session closing at 89.95 but rising as high as 90.95 to vehemently get rejected at the 20-day. Last Tuesday and this Monday, it again went sub-90 intraday to rally back above the level.
Late last month, the US dollar index lost crucial support just north of 92, which goes back to at least June 2003. Even earlier, in March this year, it peaked at 103.96. It has obviously come down a lot. Dollar bulls have an opportunity here to defend 88-89. Their nearest test lies at 90.50s, with the 10-day at 90.25.
VIX: Currently net short 101.5k, down 11.7k.
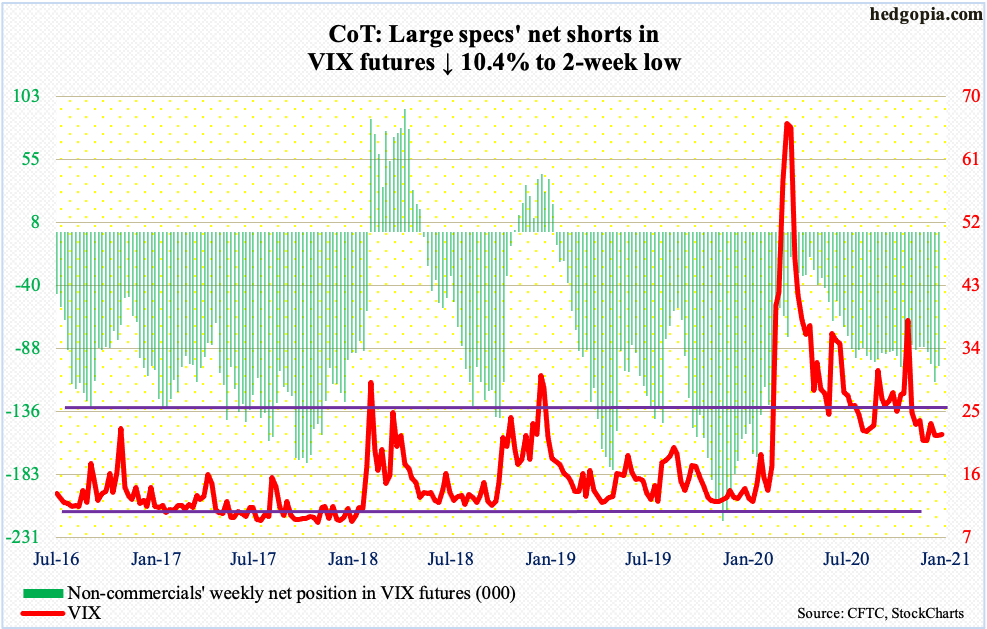
Volatility was very volatile on Monday last week. VIX (21.70) surged as high as 31.46 in that shooting star session but only to get rejected at the 200-day to close up 3.59 to 25.16, under the 50-day; the session high also kissed trend-line resistance from March when VIX shot up to 85.47.
Volatility bears would love a break of 20, which they have failed to achieve the past four and a half months. Until that happens and support turns into resistance, risk-reward odds favor that 20 holds. That said, in the very near term, the daily has room to go lower.
This blog is not intended to be, nor shall it be construed as, investment advice. Neither the information nor any opinion expressed here constitutes an offer to buy or sell any security or ...
more

