
Most Hated Bull Market Ever?
Back in November, just following the election of President Trump, I wrote about the market entering into potentially the final “melt-up” phase of the cyclical bull market.
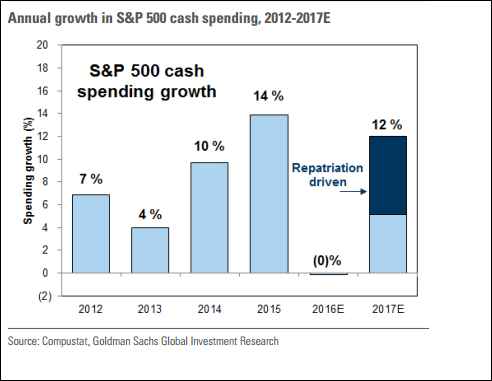
However, while economic and fundamental realities HAVE NOT changed since the election, markets are pricing in expected impacts of changes to fiscal policy expecting a massive boost to earnings from tax rate reductions and repatriated offshore cash to be used directly for stock buybacks.
To wit:
“We expect tax reform legislation under the Trump administration will encourage firms to repatriate $200 billion of overseas cash next year. A significant portion of returning funds will be directed to buybacks based on the pattern of the tax holiday in 2004.” – Goldman Sachs
“But it is not just the repatriation but lower tax rates that will miraculously boost bottom line earnings. This time from Deutsche Bank:
‘Every 5pt cut in the US corporate tax rate from 35% boosts S&P EPS by $5. Assuming that the US adopts a new corporate tax rate between 20-30%, we expect S&P EPS of $130-140 in 2017 and $140-150 in 2018. We raise our 2017E S&P EPS to $130.'”
Of course, since then it has been a “fast and furious” push to buy stocks regardless of what geopolitical or economic event was taking place.
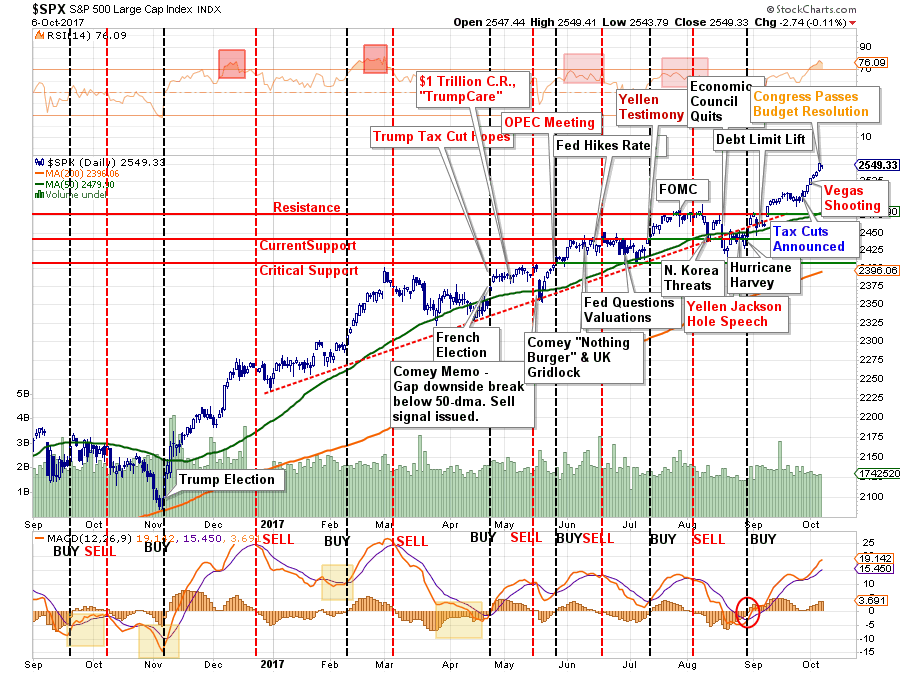
Of course, the advance is stock prices has been based purely on “hope” as nothing legislatively has actually occurred towards passing tax cuts. While no bill has been written as of yet, all of the net benefits of tax cuts have been likely priced in by the markets.
I am not discounting the rush by companies to buy back shares at the greatest clip in the last 20-years to offset the impact to earnings weak revenue growth. However, none of the actions above go to solving the two things currently plaguing the economy – real jobs and real wages.
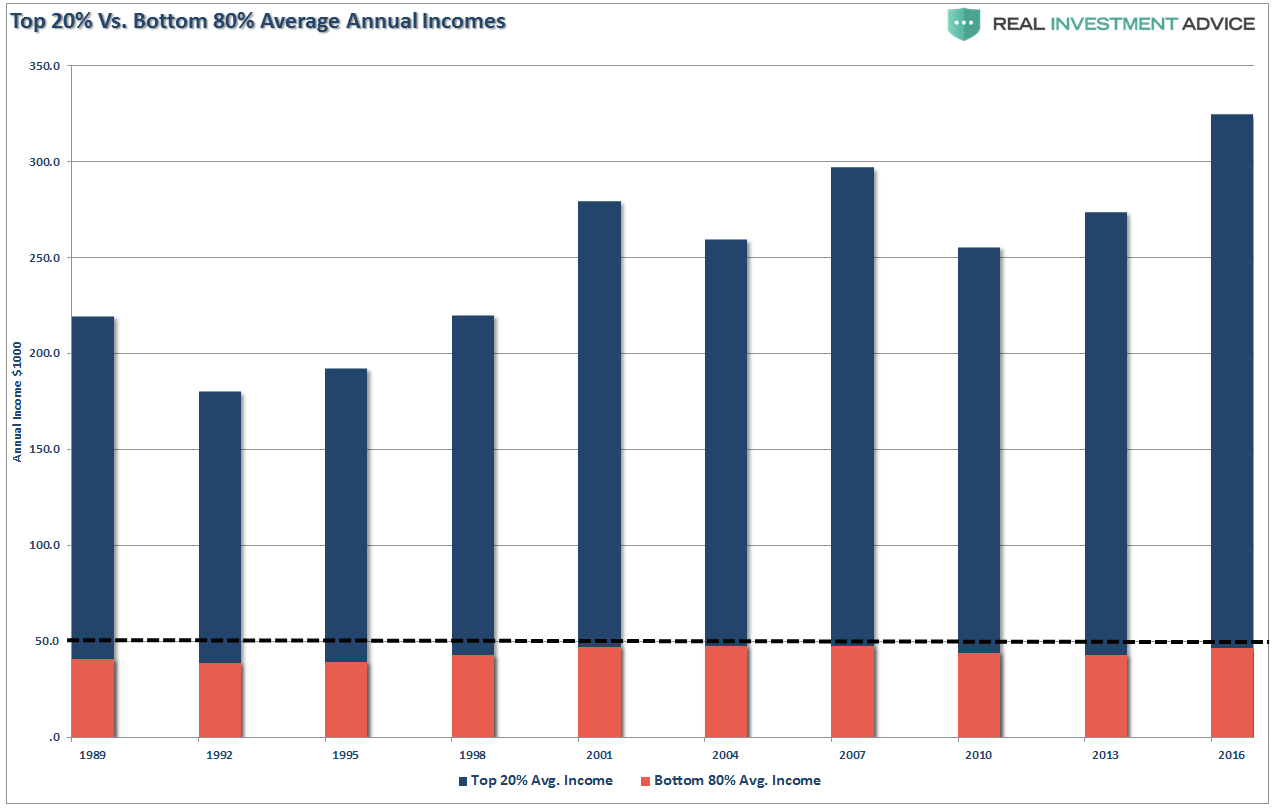
“This is also why Trump’s recent tax cut policy will fail to fuel the economic prosperity he is hoping for. With the bottom 80% of the population still earning below $50,000 on average, a tax cut will do little to increase their consumption in the economy. Those in the top 20% may well see a tax-savings from the reform but they are already consuming at a level that will likely not change to any great degree.” – The Bottom 90% & The Failure Of Prosperity
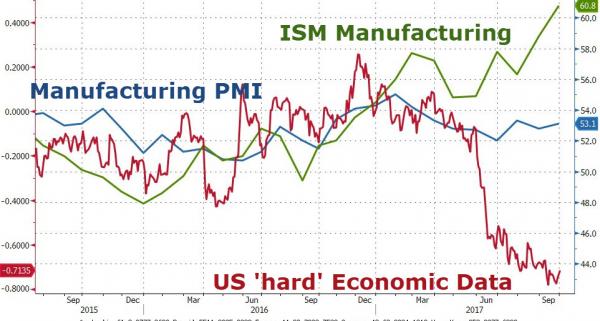
Furthermore, from an economic standpoint, most of the indicators suggest we are in a very late stage cycle relative to the markets and are acting in a similar manner as have been seen prior to the last two recessions.
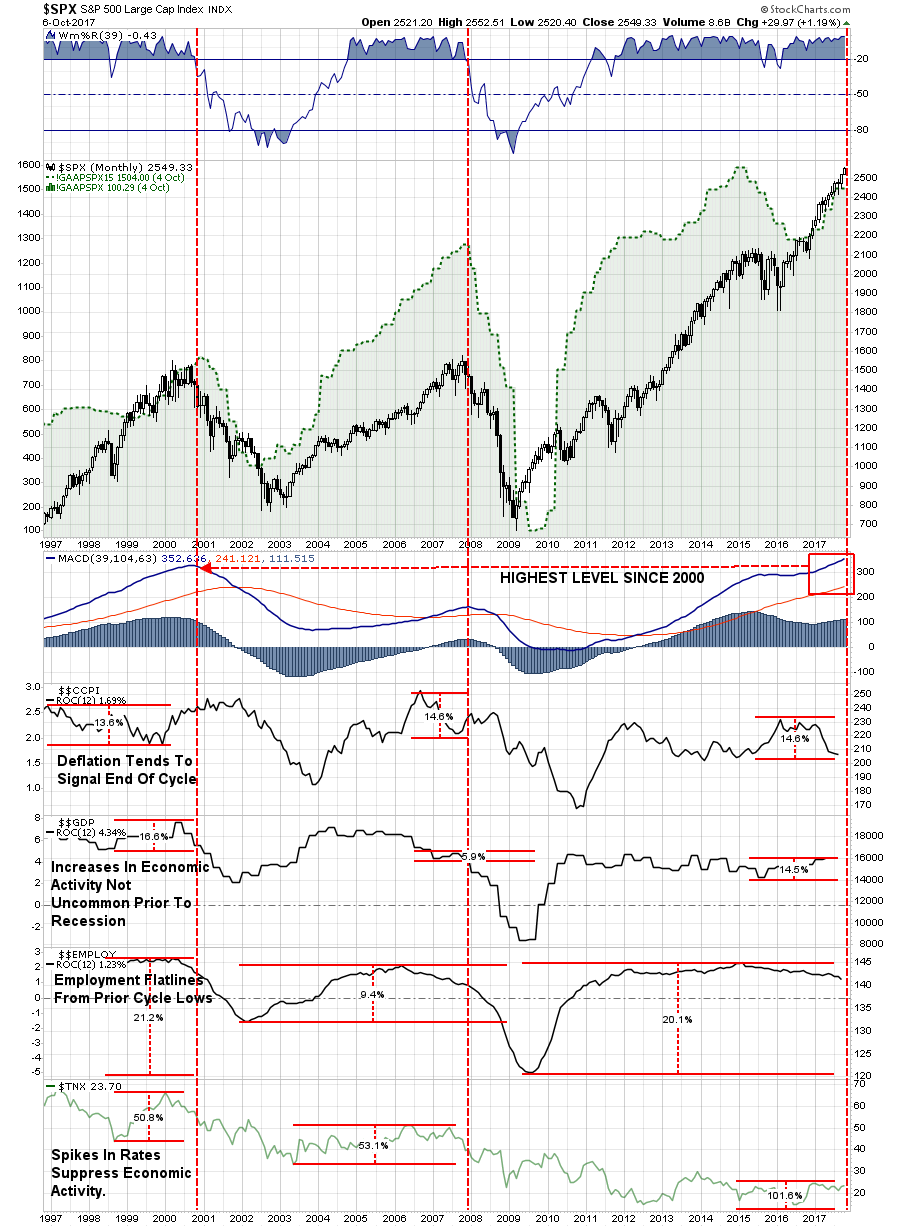
As I stated back in November:
“The rush by Wall Street to price in fiscal policy, which may or may not arrive in a timely manner, will likely push the markets higher in the short-term completing the final leg of the current bull market cycle. This was a point I addressed back in October on the potential for a rise to 2400 in the markets. With the breakout of the market to new highs, the bullish spirits have emboldened investors to rush into the most speculative areas of the market.
For now, it is all about the ‘Trump’ trade. Which is interesting considering that just before the election we were all told how horrible a Trump election would be for the world economy.”
However, it should be noted that despite the “hope” of fiscal support for the markets, longer-term conditions are currently present that have led to rather sharp market reversions in the past.
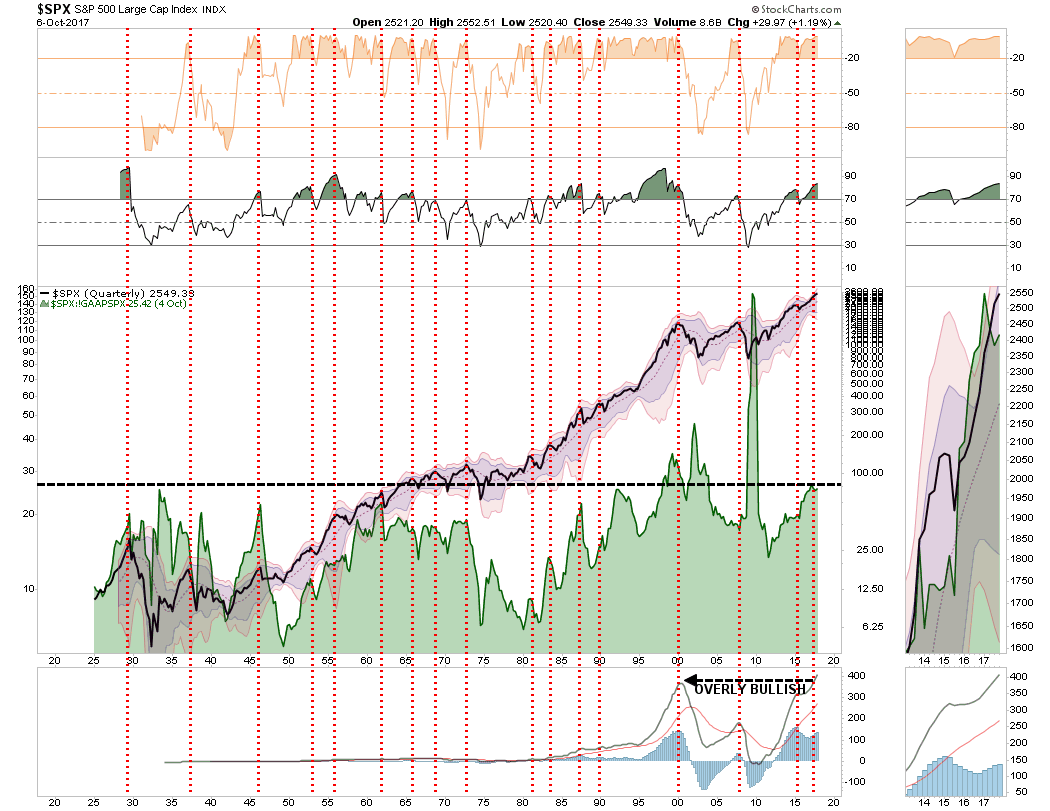
As I addressed this past week, the current environment is diametrically opposed to that of the Reagan era “tax cuts.” Therefore, the “hopes” being built into the market may ultimately be met with rather severe disappointment.
Regardless, the market is currently ignoring such realities as the belief “this time is different” has become overwhelming pervasive. As noted last week, we increased equity exposure in portfolios with the breakout above 2500. However, with the sharp rise over the last two weeks, we are beginning to look to take some profits out of small and mid-capitalization exposure and have been aggressively buying bonds this past week.
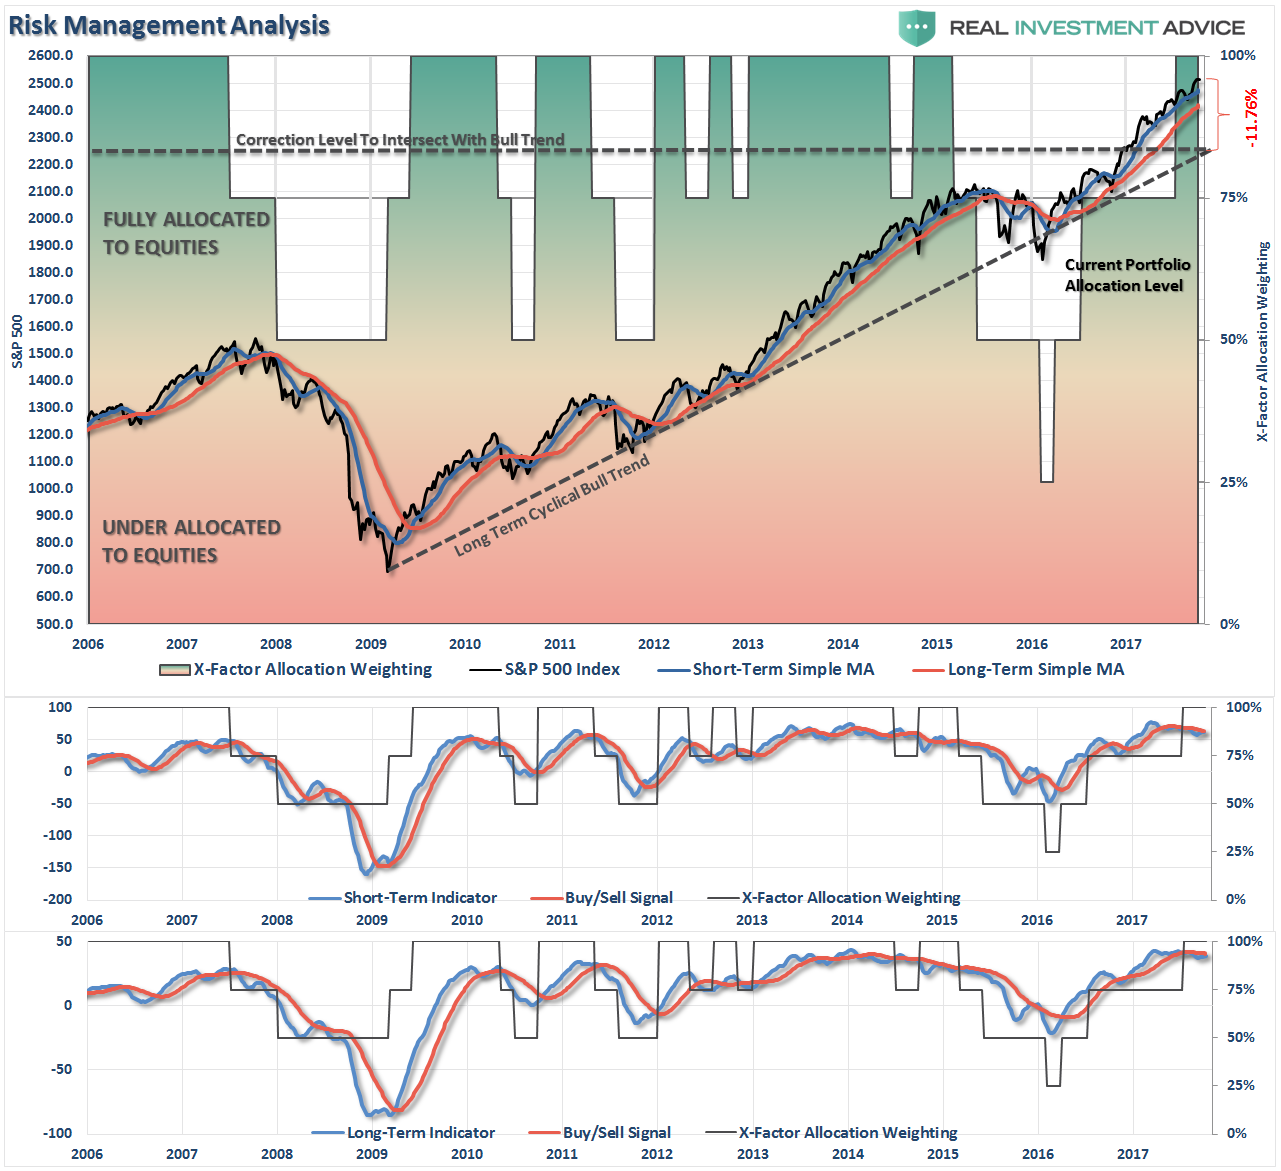
While we remain bullishly allocated currently, we are also keenly aware of the risk. As an example, the current deviation above the long-term trend line has reached more extreme levels. There is also the issue of deviations above the long-term trend line. Trend lines and moving averages are like “gravity.” Prices can only deviate so far from their underlying trends before eventually “reverting to the mean.” However, as we saw in 2013-14, given enough liquidity prices can remain deviated far longer than would normally be expected. But even that advance finally gave way.
Currently, the deviation above the long-term trend and the first major level of support are a good bit lower. A decline to the bullish trend would be roughly a -7% decline, whereas a decline to the first major level of support would entail a -17.6% decline.
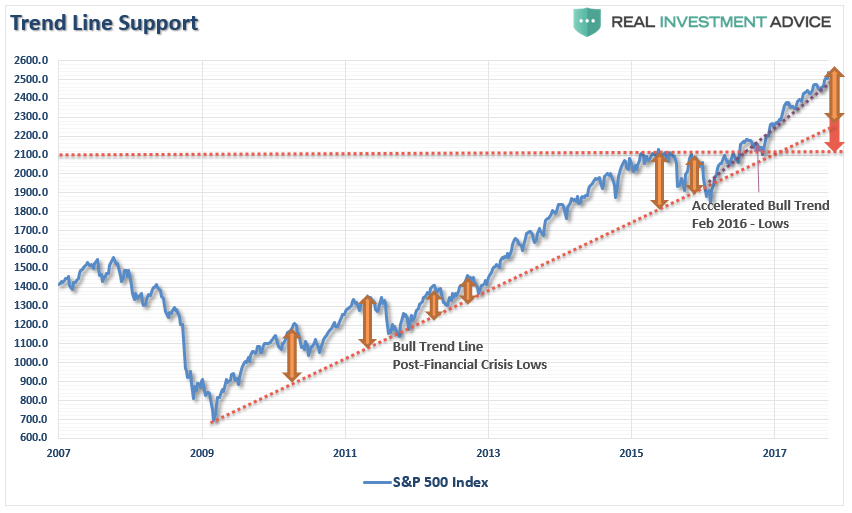
Given the length of time the market hasn’t even seen a 1%, much less a 3%, decline, a drop of these magnitudes will “feel” substantially worse than they are.
Most Hated Bull Market Ever?
This past week, my friend and colleague, Dana Lyons, penned the following note:
“Perma-bulls like to label this bull market the ‘most hated’ in history. While the rally is historic by some metrics, the ‘most hated’ status, to the degree that it was ever applicable, has certainly fallen by the wayside by now. To be sure, there are plenty of vocal and visible perma-bears that have been spewing copious amounts of ‘hate’ at this rally for years now.However, if one steps away from the confines of financial social media and guru-dom, evidence shows that public sentiment has grown to now reflect among the most bullish conditions in recorded history.”
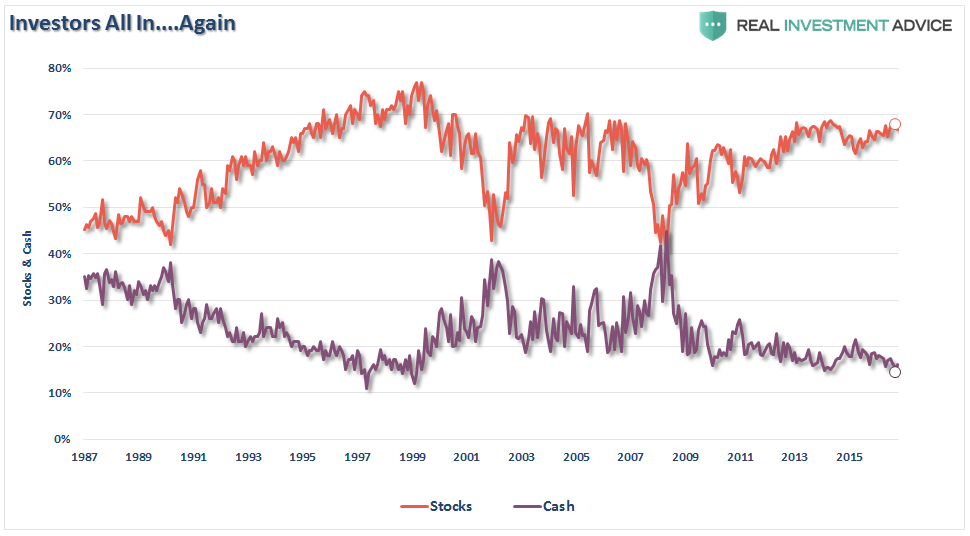
I agree. As I noted in Friday’s post entitled “A Bull Market In Complacency,” both our indicator of investor exuberance and equity allocations concur with Dana’s point.
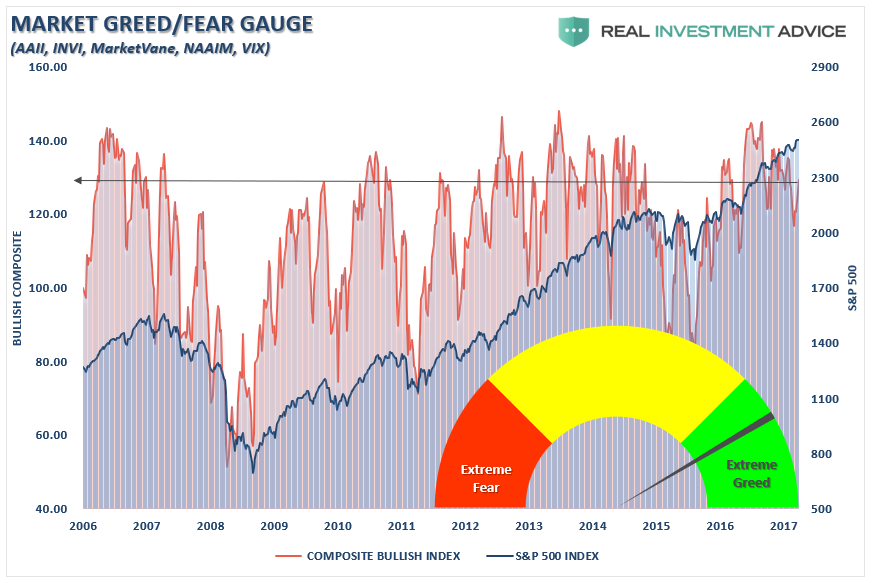
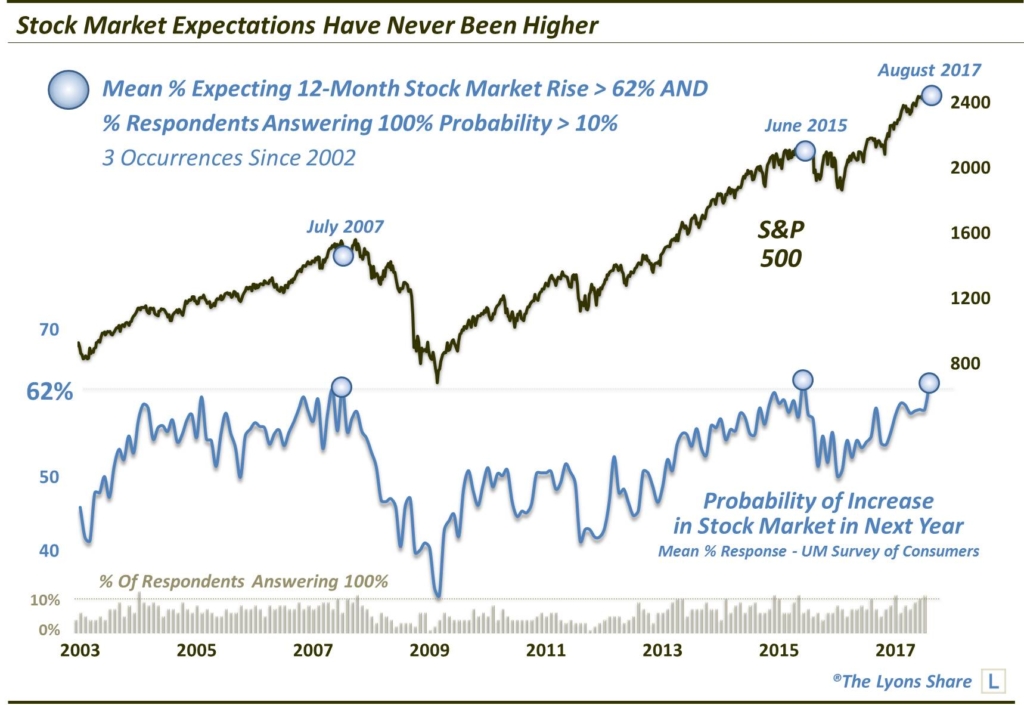
Dana also denotes another indicator hitting excessively bullish highs.
“One example comes from our Chart Of The Day based on the University of Michigan’s Survey of Consumers. One of the questions asked of respondents in the survey is their estimation of the ‘probability of an increase in the stock market in the next year’. Among the various ways that UM breaks down the data is by taking the mean response to that question. And in August’s survey, the mean response came in at 62.7%.
That trails only June 2015‘s 63.1% and joins July 2007‘s 62.2% as the only 3 readings above 62% in the history of the survey.”
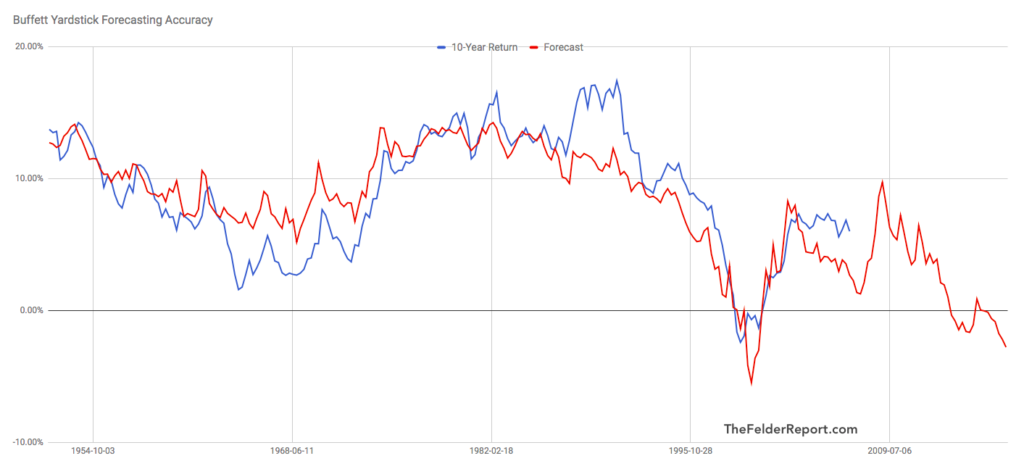
And, as Jesse Felder noted this past week, the long-term return outlook is exceedingly poor.
“As Mr. Buffett has famously said, “the price you pay determines your rate of return.” Because investors are paying one of the highest prices in history, according to this measure, they are likely to experience some of the lowest future returns on record. In fact, this measure now suggests they will experience an average annual loss of 2.8% per year over the coming decade.”
Oh, just in case you didn’t notice those charts just busted some of the most commonly held beliefs:
- There is NO CASH on sidelines
- Markets DON’T return 8% a year, and;
- Investors are all in.
This Won’t End Well
Here are some interesting stats from Adam Taggart via Peak Prosperity:
- It has been over 100 months (more than 8.5 years) since the current bull market began in April of 2009
- It has been 15 months since the last (and very brief) drop of 5% in the S&P 500
- This past September saw record low volatility, including a stretch now claimed to be “the most peaceful days in the history of the markets”
- Since last year’s presidential election, at which point the markets were already considered dangerously overvalued, the Dow Jones Industrial Average is up over 20%
- As of this article’s publishing, the Dow, the S&P, and the NASDAQ are all trading at record highs
Or visually:
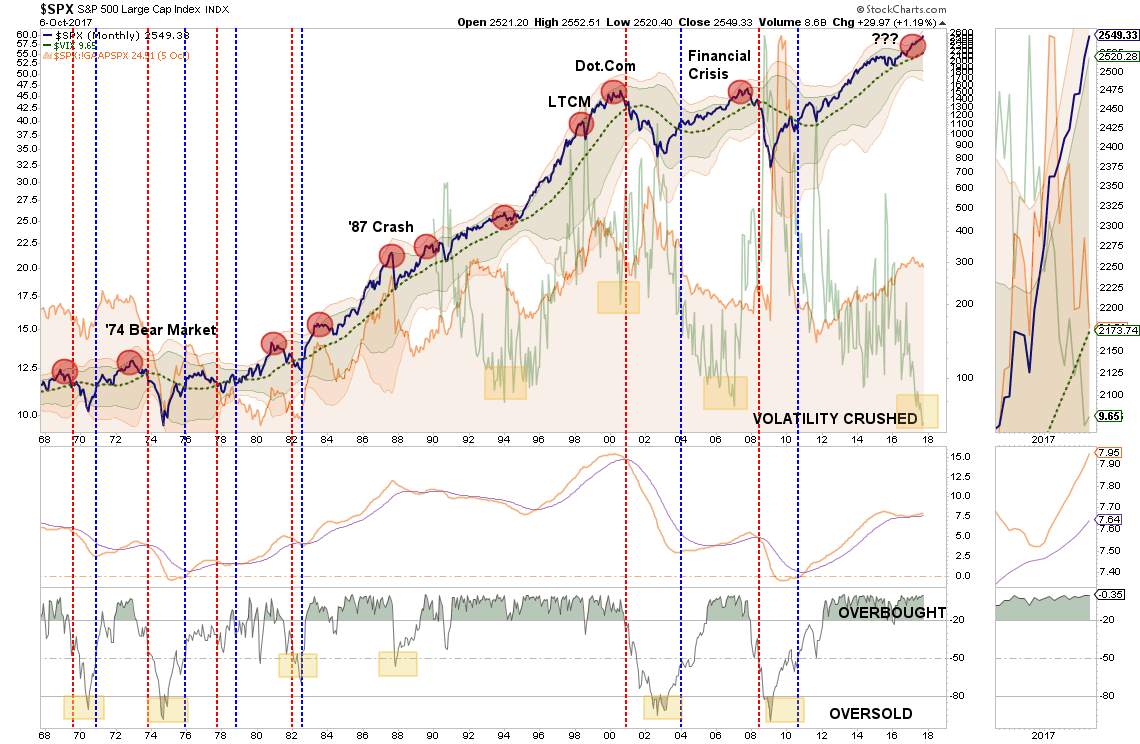
Adam goes on to state:
“The stock market is now 70% higher than it was at the previous bubble peak immediately preceding the 2008 Great Financial Crisis.
Reflect for a moment how painful the crash from Oct 2008-March 2009 was. How much more painful will a crash from today’s much dizzier heights be?
Prudent investors have asked themselves that very same question as the markets have become increasingly overvalued over the past 8+ years. Many of them — myself included — concluded that the future risks greatly outweigh the prospect of future returns, and pulled much of their capital out of the markets onto the sidelines. And since doing so, many of them — again, myself included — have watched prices climb higher and still higher again.
It’s understandable to feel great frustration both at the irrationality of today’s market prices and at the emotional sting of missing out on the gains they’ve been delivering to those who have blithely remained long.
But it’s very important to remember we’ve been here before many times throughout history (and pretty recently when reflecting back on the Tech and Housing bubbles). While today’s levels are at a historic extreme, markets have always swung from periods of overvaluation to undervaluation — and then back again.
During the peaking process, the siren call to join the party is incredibly hard to resist. Waiting out the irrational exuberance leading up to a market top is painful. Profitable returns are everywhere. How can you turn down making such easy money?
As Tom Petty sympathized: The waiting is the hardest part.”
The “siren’s song” of tax cuts and tax reforms will likely turn out to be the very rocks this ship cracks up on. The potential for disappointment dramatically outweighs the potential of Congress meeting the current expectations of the market participants.
As I noted in the 80/20 rule of investing:
“Importantly, as a portfolio manager, I am buying the breakout because I have to. If I don’t, I suffer career risk, plain and simple.
However, you don’t have to. If you are truly a long-term investor, you have to question the risk being undertaken to achieve further returns in the market.”
While we remain long the market currently, we are doing it with a very keen eye towards the risk we are taking. We continue to carry tight stop-loss levels and are de-risking portfolios by trimming exposures as needed and being opportunistic with our fixed income exposure.
As I concluded previously:
“However, the longer-term dynamics are turning more bearish. When those negative price dynamics are combined with the fundamental and economic backdrop, the “risk” of having excessive exposure to the markets greatly outweighs the potential “reward. “
While it is certainly advisable to be more “bullish” currently, like picking up a “porcupine,” do so carefully.
Investing is not a competition.
It is a game of long-term survival.”
Market & Sector Analysis
Data Analysis Of The Market & Sectors For Traders
S&P 500 Tear Sheet
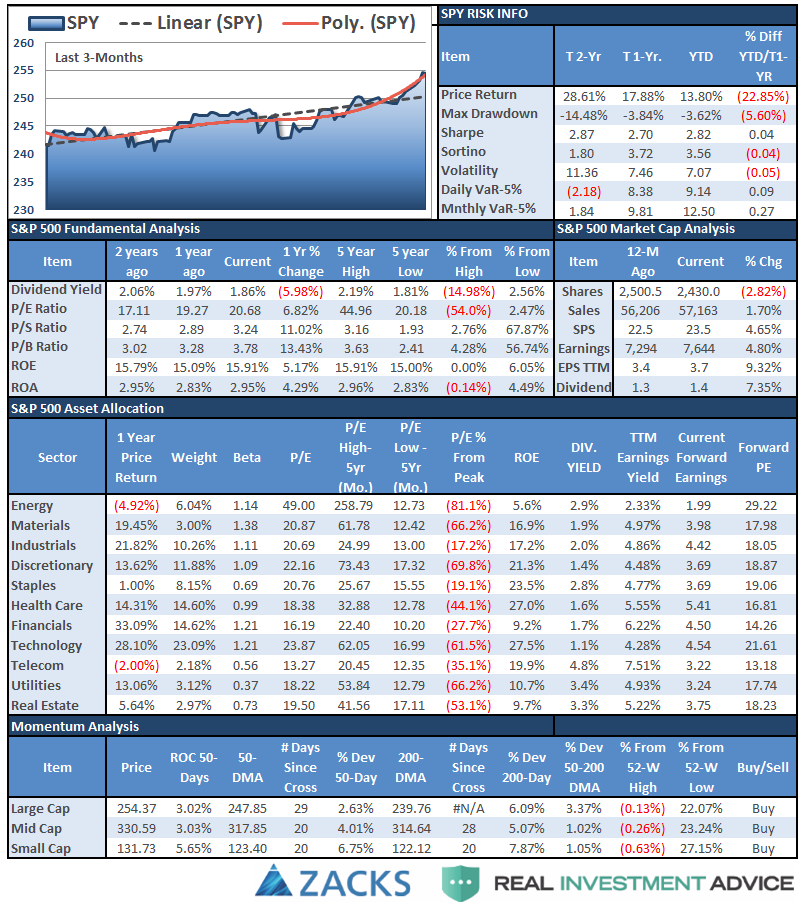
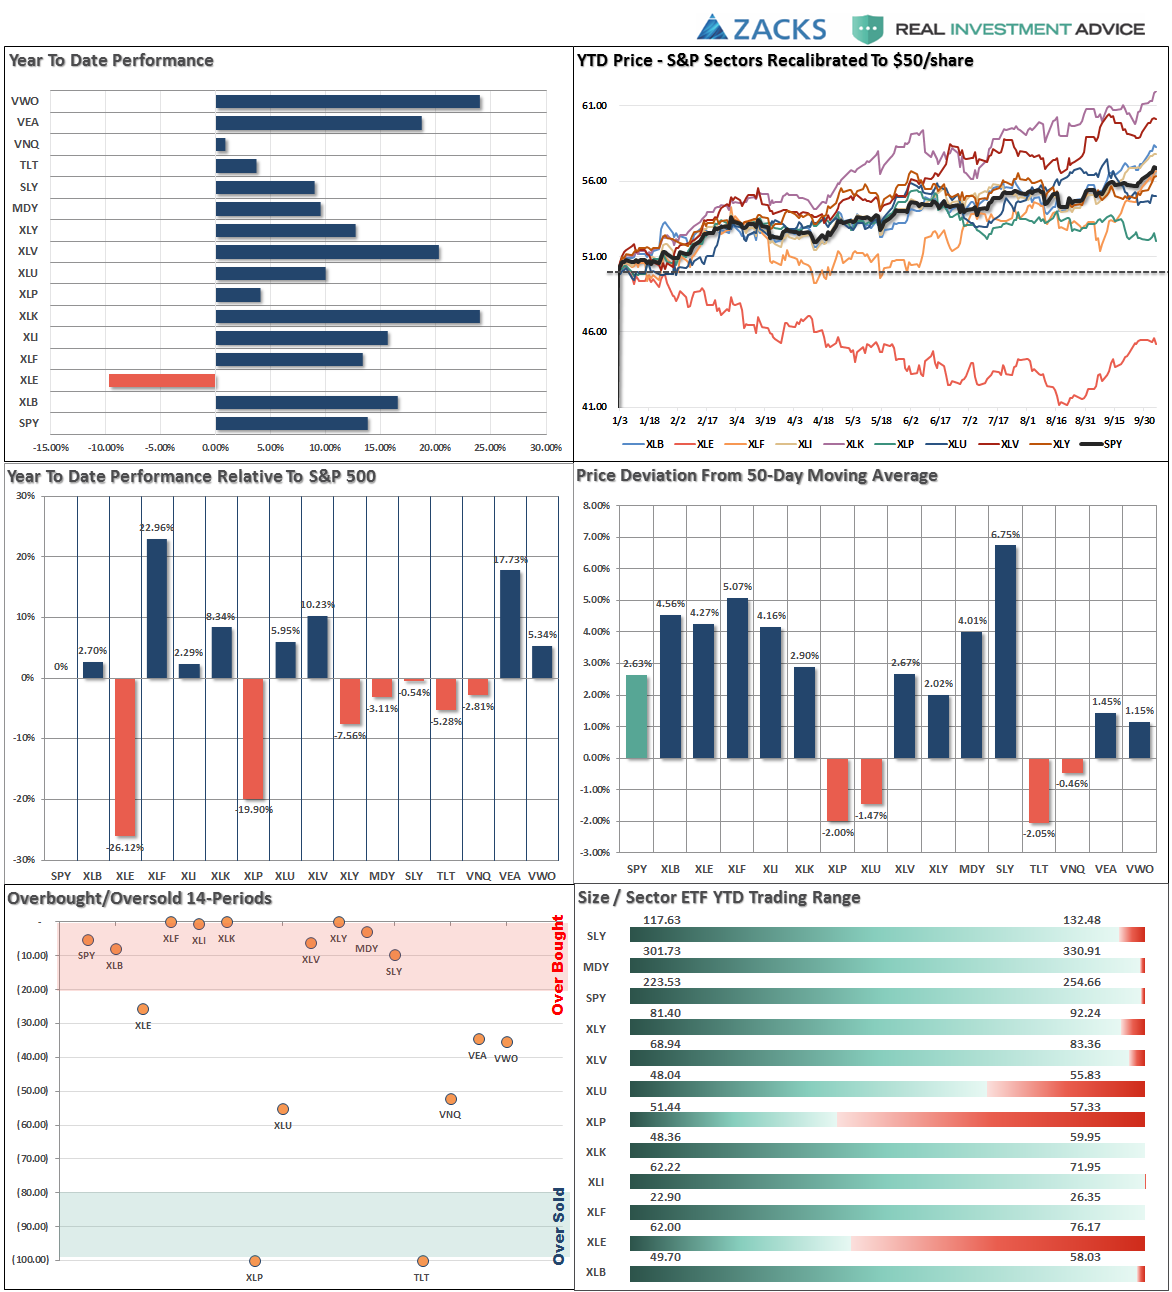
Performance Analysis
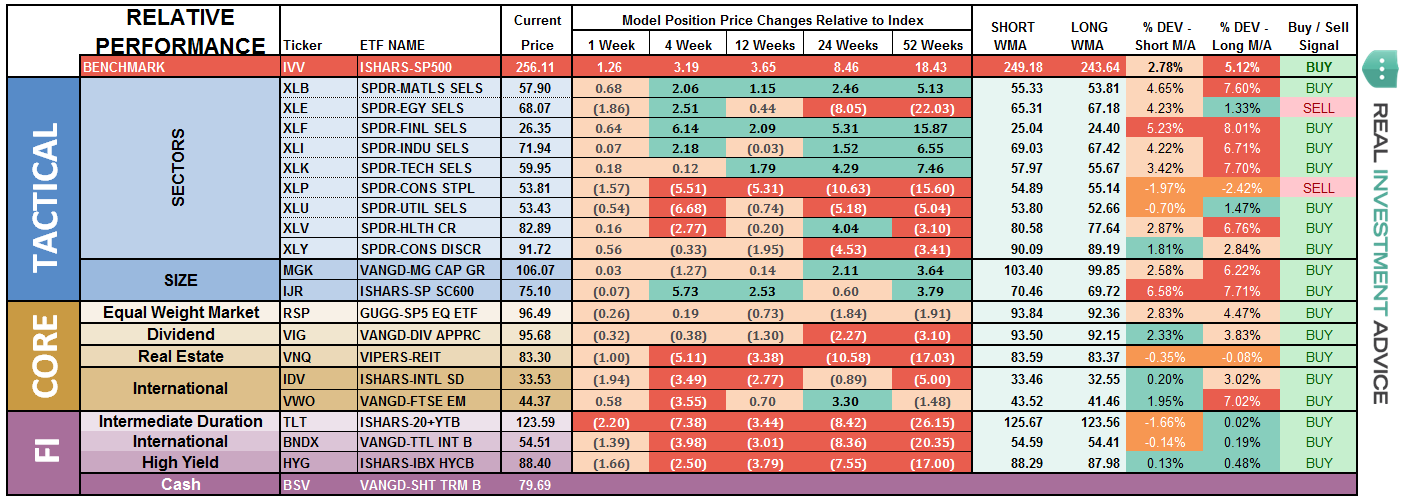
ETF Model Relative Performance Analysis
Sector & Market Analysis:
Let’s take a look at the sector breakdown.
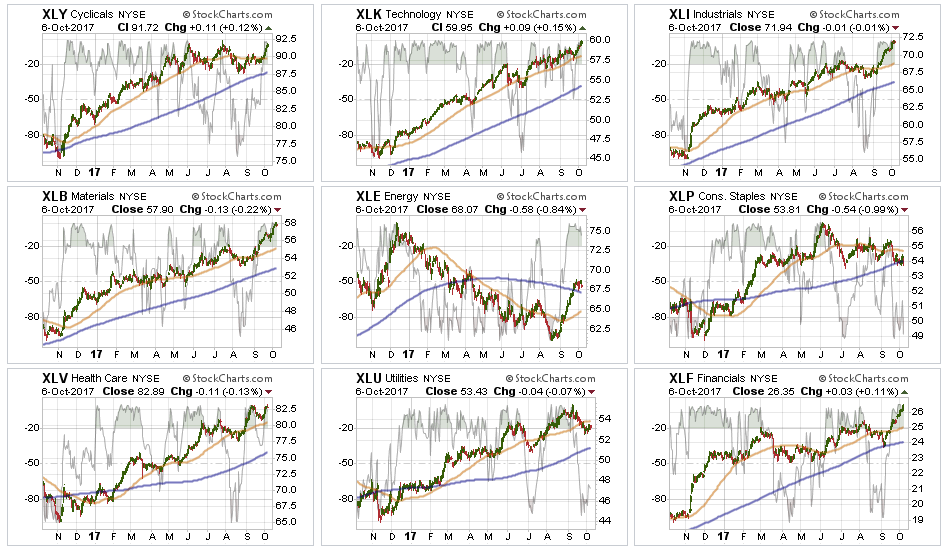
Technology, Health Care, Industrials, Materials, and Financials – continued to lead this past week. With these sectors now back to very overbought levels in the short-term, some profit taking is advised. The big advance in Industrials and Materials is the revival of the “Trump Trade” on hopes of tax reform and infrastructure spending. Both of these areas are at risk of disappointment from D.C. – take some money off the table.
Energy, as noted over the last four weeks, has mustered a decent bounce but the trends and backdrop remain sorely negative. The pop in oil prices to $52/share is likely largely done as the underlying fundamentals for the sector remain weak. While the underlying technicals are beginning to improve, the sector must stay above the 50-dma. A violation next week will likely return the sector back to it previous downtrend. We continue to remain out of the sector entirely currently, but if the recent improvement can reverse the negative trends we will add weight to portfolios.
Discretionary and Staples have been under pressure as the consumer weakness continues to spread through the underlying companies. That story is a macroeconomic story that is being ignored by the rest of the market currently, however, it will eventually be the “tail that wags to dog.”
Utilities are once again VERY oversold but the pop in interest rates following the announcement of the Trump Tax Plan led to a violation of the 50-dma. Stops should be moved up to $51 and any violation of the 200-dma should be watched closely.
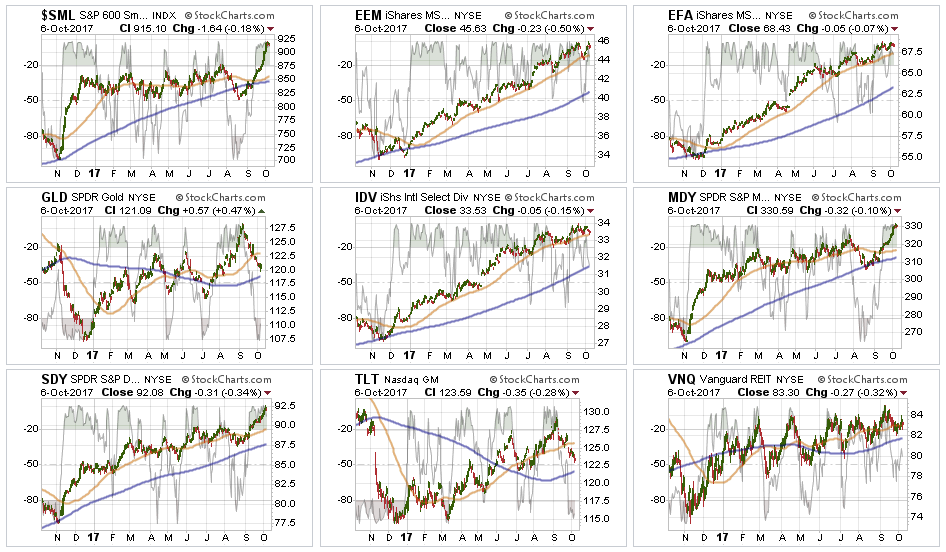
Small and Mid-Cap stocks continued strong advance from last week. With both indices back to extreme overbought levels, stops should be moved up accordingly. The moves to new highs for both markets provides some impetus for the market’s push higher in the short-term. We are taking profits in both of these sectors as they are now pushing 4-standard deviation extremes of the moving averages.
Emerging Markets and International Stocks continue to hold support and money has been chasing performance in these sectors as of late. Remain long these sectors for now.
Gold – as feared, Gold has begun to reverse the recent breakout as the “fear trade” has all but dissipated. We will continue to watch for technical strength to support adding exposure to portfolios. For now, we remain on the sidelines.
S&P Dividend Stocks, after adding some additional exposure recently the index broke out to new highs. We are holding our positions for now with stops moved up to recent lows. Take some profits and rebalance accordingly.
Bonds and REIT’s finally had some profit taking hit these positions last week on the “risk” rotation. As stated last week:
“REIT’s are looking to break out of a long consolidation cycle and bonds remain favorable. Continue holding current positions for now but we are looking to take some profits and rebalance holdings.”
We did take profits in bonds and began more aggressive buying in bonds late this past week. We will continue to add more exposure if rates push towards 2.5% which is our target for this reversal.
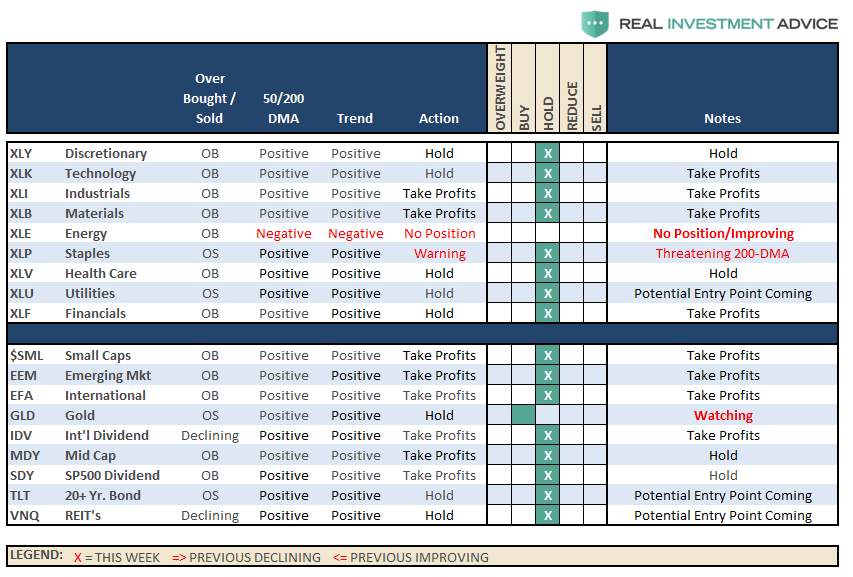
Sector Recommendations:
The table below shows thoughts on specific actions related to the current market environment.
(These are not recommendations or solicitations to take any action. This is for informational purposes only related to market extremes and contrarian positioning within portfolios. Use at your own risk and peril.)
Portfolio Update:
The breakout of small and mid-cap stocks over the last three weeks supports the ongoing bullish trend of the market. As noted above, this trend keeps our portfolios allocated toward equity risk. We remain cautious of potential corrections giving the length of time the markets have been absent one, but there is no use fighting the excessively bullish sentiment for now. The break of the market above 2500 allowed us to allocate some capital in new accounts toward equity-related risk.
Also, as noted, we used the pop in interest rates to move cash management accounts, and larger cash holdings, into our cash allocation strategy providing for better yields. We also added some new bond exposure to accounts and are looking for additional opportunities if rates push higher over the next couple of weeks.
We remain extremely vigilant of the risk that we are undertaking by chasing markets at such extended levels, but our job is to make money as opportunities present themselves. Importantly, stops have been raised to trailing support levels and we continue to look for ways to “de-risk” portfolios at this late stage of a bull market advance.
As always, we remain invested but are becoming highly concerned about the underlying risk. Our main goal remains capital preservation.
THE REAL 401k PLAN MANAGER
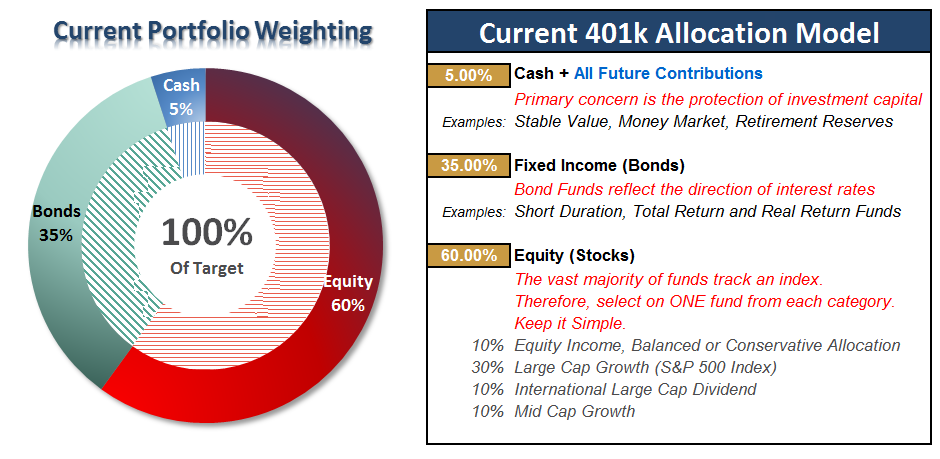
The Real 401k Plan Manager – A Conservative Strategy For Long-Term Investors
There are 4-steps to allocation changes based on 25% reduction increments. As noted in the chart above a 100% allocation level is equal to 60% stocks. I never advocate being 100% out of the market as it is far too difficult to reverse course when the market changes from a negative to a positive trend. Emotions keep us from taking the correct action.

Bull Charge Getting A Bit Ahead Of Itself
As noted last week, bullish trends remain in place, so portfolio allocations remain at target levels for now.
The markets are now extremely extended on several fronts. As noted in the chart above, it would require a near 12% decline just to intersect with the support and the long-term bullish trend. Extreme deviations from long-term trends don’t last forever, so caution is advised with overly aggressive exposure. We suggest taking the recent advance as an opportunity to rebalance risk in portfolios by trimming overweight equity exposure and adding to fixed income exposure is a prudent goal this week.
Specifically, reduce small and mid-capitalization exposure back to TARGET percentages. Use the cash raised from rebalancing to increase bond exposure back to target weights as well.
All NEW contributions to plans should currently be adjusted to cash or cash equivalents like a stable value fund, short-duration bond fund or retirement reserves. Stop loss levels should be moved up accordingly.
Current 401-k Allocation Model
The 401k plan allocation plan below follows the K.I.S.S. principle. By keeping the allocation extremely simplified it allows for better control of the allocation and a closer tracking to the benchmark objective over time. (If you want to make it more complicated you can, however, statistics show that simply adding more funds does not increase performance to any great degree.)
401k Choice Matching List
The list below shows sample 401k plan funds for each major category. In reality, the majority of funds all track their indices fairly closely. Therefore, if you don’t see your exact fund listed, look for a fund that is similar in nature.

Disclosure: The information contained in this article should not be construed as financial or investment advice on any subject matter. Streettalk Advisors, LLC expressly disclaims all liability in ...
more

