
Market Completes A 50% “Bear Market” Retracement
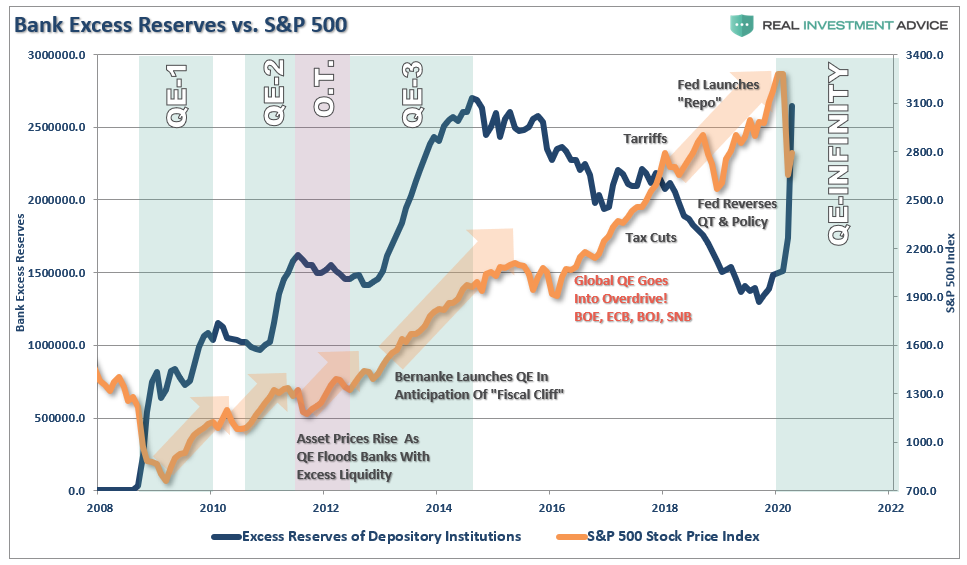
“If you wonder why we’re seeing such a HUGE divergence the past 3 weeks between the economy and where investor psychology has taken the market…just remember…it’s all about the Fed.
Market psychology is having a ‘V’ shaped recovery from total panic while the economy still looks horrible. S&P futures implied volatility is down 50% from the ‘max panic’ level it hit mid-March.
Can the ‘psychological rally’ be sustained? Is this just a vicious ‘Bear Market Rally?’ Will the ‘reality’ of a devastated global economy pull the market back down? And if market price action shows us that investors are growing fearful again will the Fed just throw up their hands and say, ‘Sorry, we gave it our best shot and that’s all we could do?’ I don’t think so. In for a penny…in for a pound.” – Victor Adair, PI Financial
Victor is correct.
As I noted in Friday’s #MacroView:
“In the short-term, the Fed is massively increasing the liquidity of banks (excess reserves) through the various ‘Q.E’ facilities to stave off a second ‘financial crisis.’ Given the banks do NOT want to loan out any funds not guaranteed by the Federal Reserve, the excess liquidity flows into asset markets.”
Not surprisingly, as discussed previously:
“From a purely technical basis, the extreme downside extension, and potential selling exhaustion, has set the markets up for a fairly strong reflexive bounce. This is where fun with math comes in.
As shown in the chart below, after a 35% decline in the markets from the previous highs, a rally to the 38.2% Fibonacci retracement would encompass a 20% advance.
Such an advance will ‘lure’ investors back into the market, thinking the ‘bear market’ is over.”
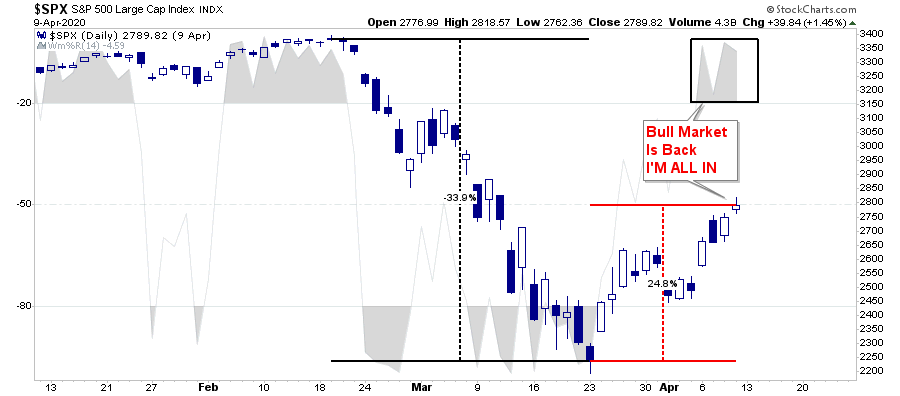
Over the last couple of weeks, we have indeed had an extremely strong “oversold,” reflexive rally, that has now reversed the conditions that “fueled” the advance.
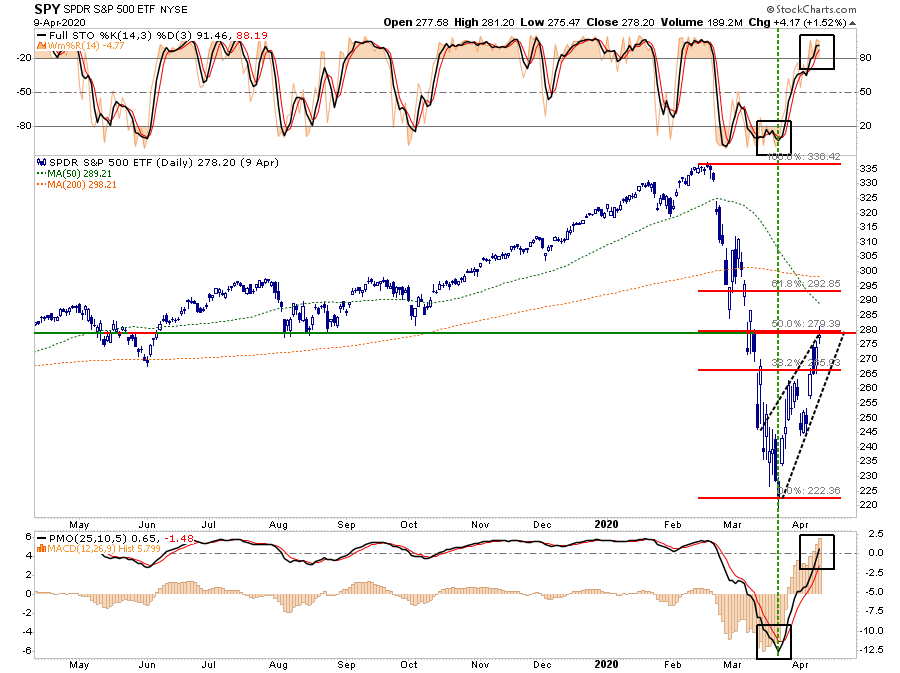
As shown above, all previous short-term oversold conditions have been fully reversed, with the market completing a typical 50% retracement of the previous decline. This was also a point made by my colleague Jeffery Marcus of TP Analytics this past week for our RIAPro Subscribers (30-day Risk Free Trial)
“The S&P500 has now rallied 19% off of its low close of 2237.40 on 3/23 and 21% from its intraday low of 2191.86 on 3/23. The benchmark is now within sight of its 50% retracement.
By definition, a 50% retracement of the S&P500 would be a rally that retraced 50% (+574) of the net loss (-1148) from 2/19 to 3/23. The chart below shows that the 50% retracement level is approximately S&P500 2811 (the low of 2237 + 574 = 2811).
It is very hard in the volatile environment to be too exact, but at the S&P 500 2800 – 2830 level, the risk/return trade-off becomes bad for the market.”
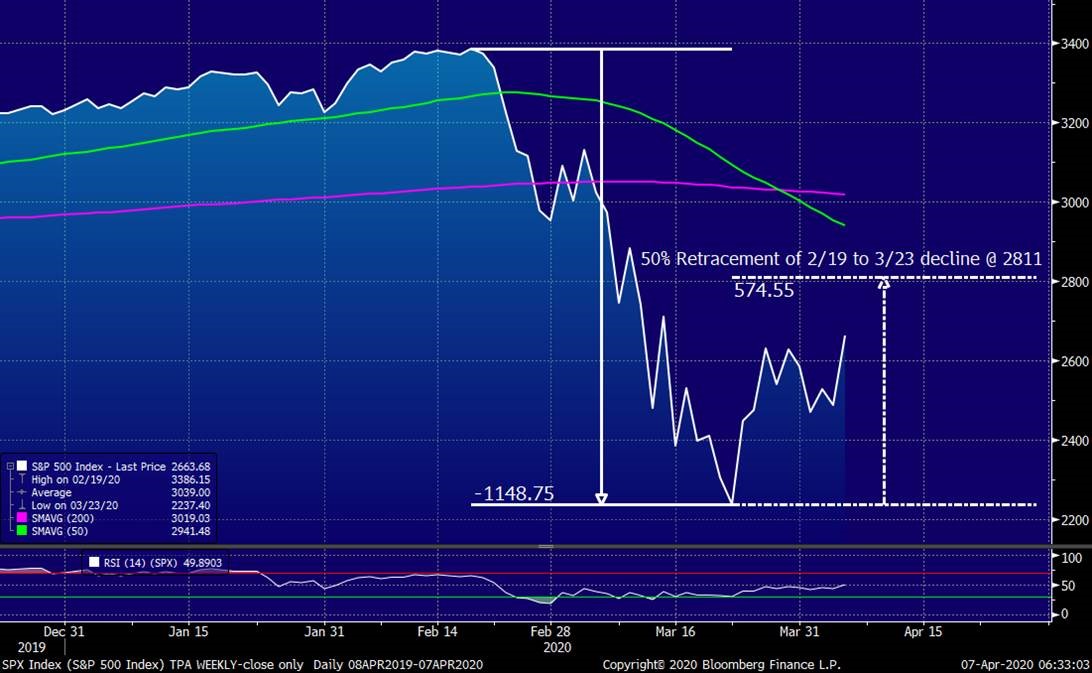
On Friday, the market hit an intraday high of…2818.57 before selling off into the close.
A Look Back
Here, let me save you the trouble of emailing me.
“But Lance, like Victor says, the Fed is pumping the markets full of liquidity. So, ‘Don’t Fight The Fed.'”
Or, even tweeting me:

As noted above, excess liquidity WILL flow into markets short-term; however, eventually, the markets will reflect the underlying economic destruction.
While 2008 was bad, the impact from the “economic shutdown” due to the virus will be substantially worse for several reasons:
- In 2008, the economy was already slowing down, unemployment was already on the rise, and businesses were adjusting for the related impact to earnings. Also, despite the “crisis” caused in the mortgage market, businesses and consumer activity remained “open.”Outside of the real estate and finance industries, many other sectors were only marginally affected.
- In 2020, the shuttering of the economy caught many businesses “flat-footed” and ill-prepared for an involuntary “shuttering” of business.
- In 2020, the surge in unemployment, combined with a shuttering of business, will have a substantially deeper impact on gross consumption in the economy than in 2008.
- As opposed to 2008, there are many businesses that will not ever reopen, many more will be very slow to recover, with the rest very slow to rehire until demand returns.
The markets are currently rallying on a flush of liquidity, and a massive short-covering rally, which is likely reaching its “exhaustion” stage. Over the next few months, stocks will begin to price in the severity of the economic damage, a substantial decline in earnings, and the realization that hopes for a “V-Shaped” recovery are not likely.
While there are lots of market analogs making the rounds comparing the current crash to 1929, 1987, and a host of other periods, it is 2008, which has the most similarities. (I am not a fan of analogs, but if you want one, this is the most logical.)
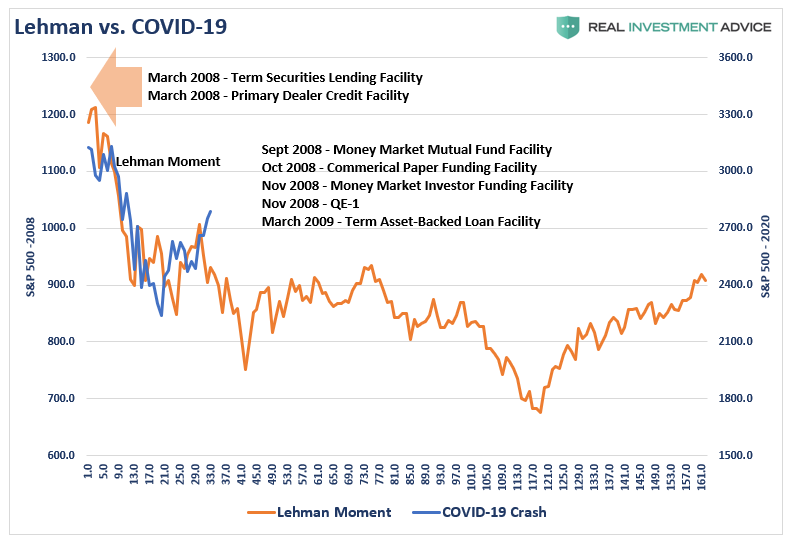
In 2008, the Fed had already started bailing out banks in early March as Bear Stearns failed. The Fed was also aggressively lowering interest rates to Zero. In 2008, the Fed lowered rates by 5.25% versus just 1.5% currently. While the market initially rallied after the Bear Stearns bailout, and even set new highs shortly thereafter, the economic crisis was still revving up.
The depth of the crash came in September 2008. Importantly, after the failure of Lehman Brothers, the market rallied nearly 20% from its lows in late October as the Federal Reserve, and the Government through fiscal policy, and an alphabet of bank support programs, began to intervene aggressively. That rally took markets back to a short-term overbought condition.
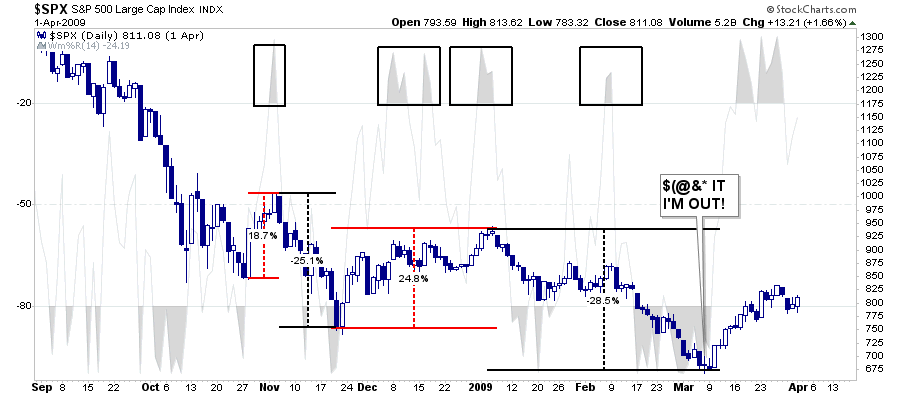
Following that rally, the reality of the economic devastation began to set in as unemployment skyrocketed, consumption and investment contracted, and earnings fell nearly 100% from their previous peak. The market declined 26% into late November until the Federal Reserve launched the first round of Quantitative Easing.
With liquidity flooding into the system, stocks once again staged an impressive rally of almost 25% from the lows.
Yes, the bull market was back.
Except that it wasn’t.
Over the next few months, the market once again sold off, falling 28.5% from the prior “bear market rally” high.
By the time the end of February 2009 came, it was widely believed that “NOTHING” would save the markets. Headlines from the media were filled with stories that the Dow would fall to zero.
Most importantly, there was NO ONE that wanted to “Buy The Market.”
That all happened despite the Federal Reserve’s, and Government’s, intervention programs. As noted in our #MacroView:
“The problem with monetary policy, in all of its forms, is that it disincentivizes capitalism.
Zero-interest rates, excess liquidity, and a closed-loop between the banks and the Fed, removed all incentives to “take risks” of lending money to businesses and individuals to create economic growth. Instead, that liquidity, fueled asset prices, stock buybacks, and corporate debt which engendered a wealth gap never before seen in history. In fact, there is no evidence QE leads to increased monetary velocity, or rather the transfer of liquidity into the economic system, at any level.”
Still A Bear Market Rally?
Yes, we have had a very strong rally on hopes that Federal Reserve unprecedented interventions will fix the problem. Not unlike the “bear market” rallies seen each time in 2008, the current rally has taken the market back to more extreme short-term overbought conditions.
While there are many suggesting the markets are “looking past” the current quarter, I would suggest such really isn’t the case.
This has been an oversold bounce, fueled by a lot of “short-covering,” in the most heavily shorted stocks.
What markets have not done is to price in the economic devastation that is coming from:
- A complete shutdown of the economy.
- 15 million jobless claims in 3 weeks
- 20%+ unemployment
- 20-25% negative GDP growth
- 30% of mortgages in forbearance
- A dramatic drop in both personal and corporate consumption
- A massive reduction in capital expenditures and private investment
- A crushing of consumer and business confidence
- A depletion of consumer and corporate savings
More importantly, markets are still operating on expectations the “hit” to “reported earnings” is going to be extremely small. Using Q4-2019 as the last viable reporting period.
- Q1-20 earnings are expected to only decline by 2.36%
- Q4-20 earnings will decline just 2.71%, and;
- Q4-21 earnings are expected to surge by 19.62%
Such small reductions in “estimates” hardly account for economic weakness, let alone the devastation that is occurring, and will continue.
Furthermore, as I penned last week in Aannd It’s Gone, share buybacks, which have been a primary support of the financial markets and specifically earnings per share, are now gone.
If we “round up,” and use 2800 as Friday’s close, current valuations, according to S&P, are 20.56x. (Still expensive, but lower than recent peaks)
However, if earnings ONLY decline to just $100/share, which is optimistic, then valuations are 28x earnings.
No “bear market,” in history, for any reason, ever ended with valuations between 20-28x earnings.
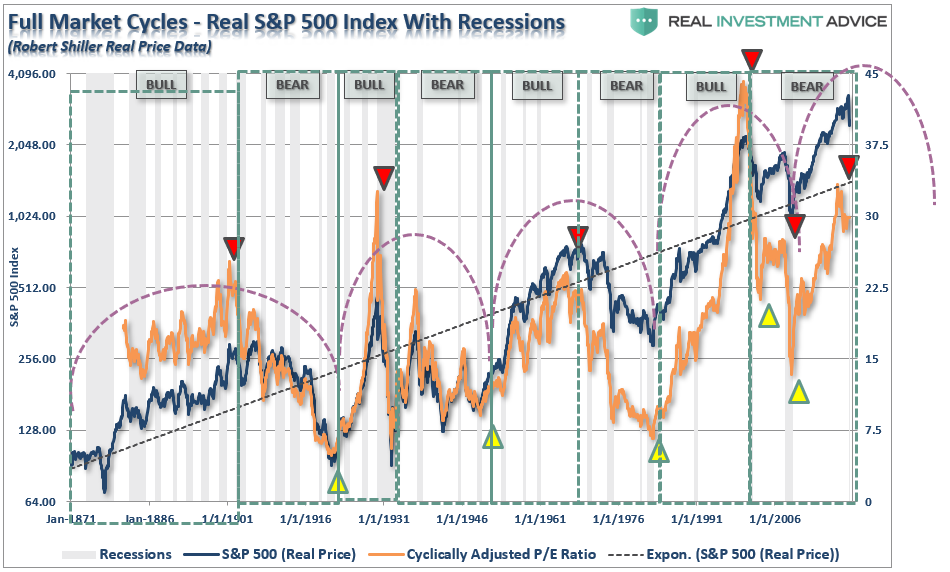
As we discussed last week in 4-Phases Of The Full-Market Cycle:
“Valuations drive stock markets and returns over time. Famed investor Jack Bogle stated that over the next decade we are likely to see two more 50% declines.A 50% decline from the all-time highs would put the market at 1600.”
If you are hoping the “bear market” is over, and have jumped back in with all your capital, you are in good company, as many others, judging by my twitter feed, have done the same.
Just be prepared to be disappointed in the months ahead.
In the meantime, we choose to continue to manage our risk, and our clients' capital, cautiously, and judiciously.
Market & Sector Analysis
Data Analysis Of The Market & Sectors For Traders
S&P 500 Tear Sheet
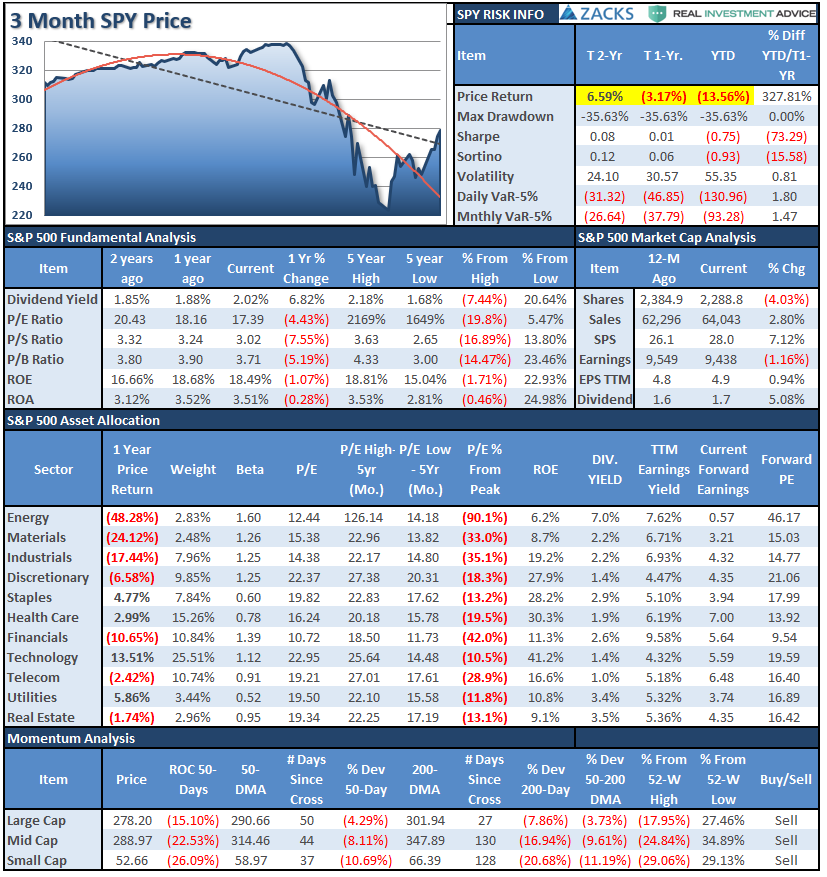
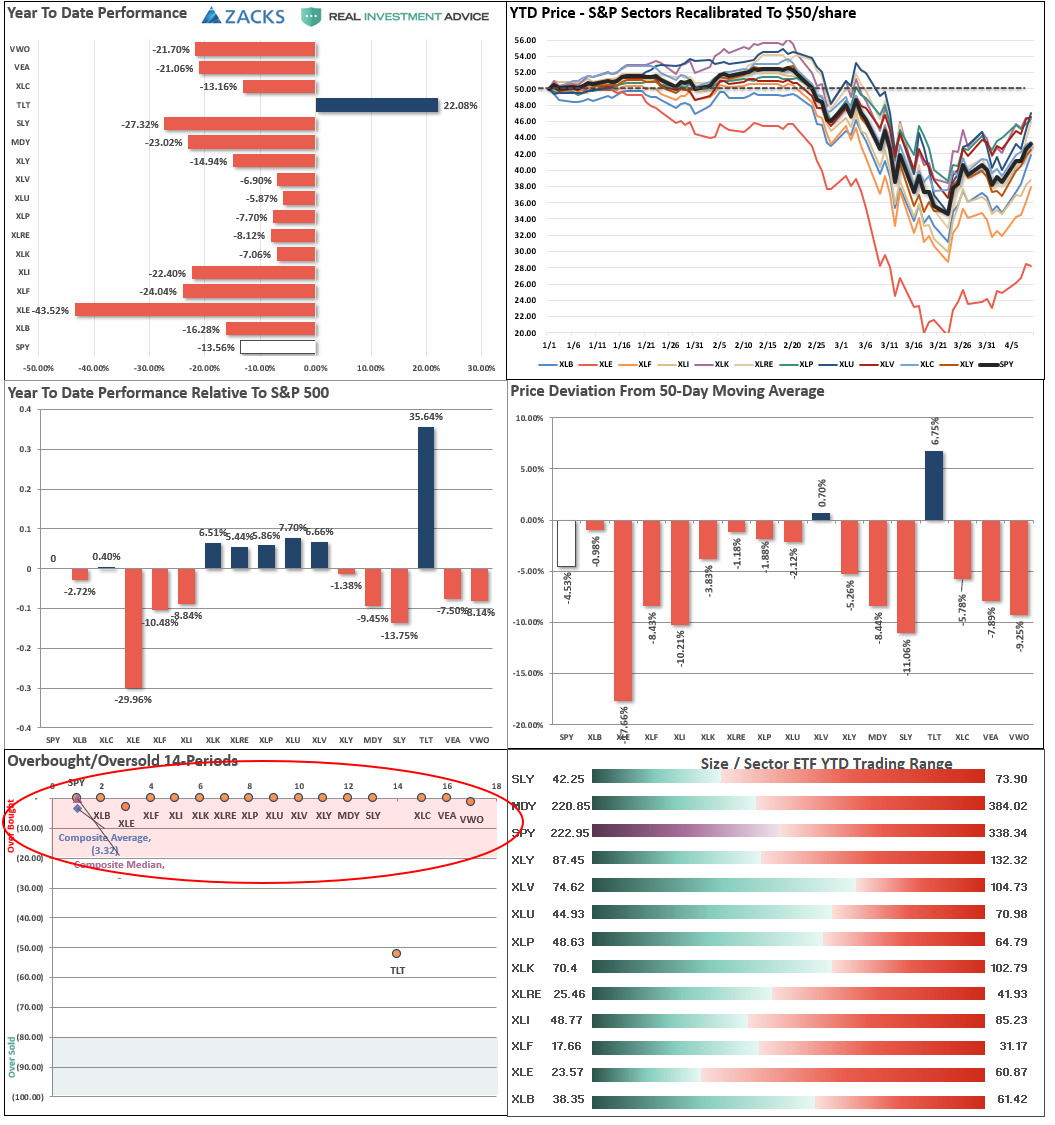
Performance Analysis
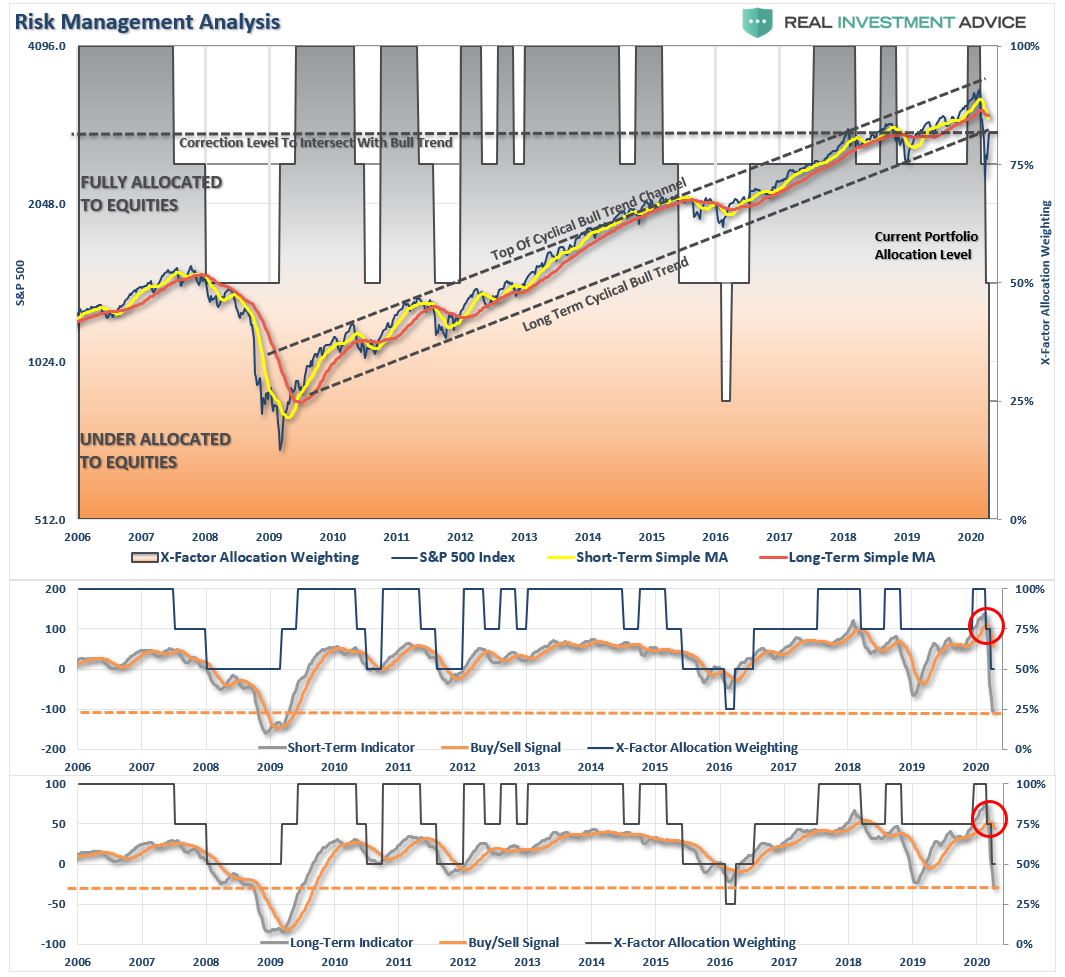
NOTE: I have rarely seen EVERY SECTOR overbought this much all at the same time. The market WILL CORRECT from these levels.
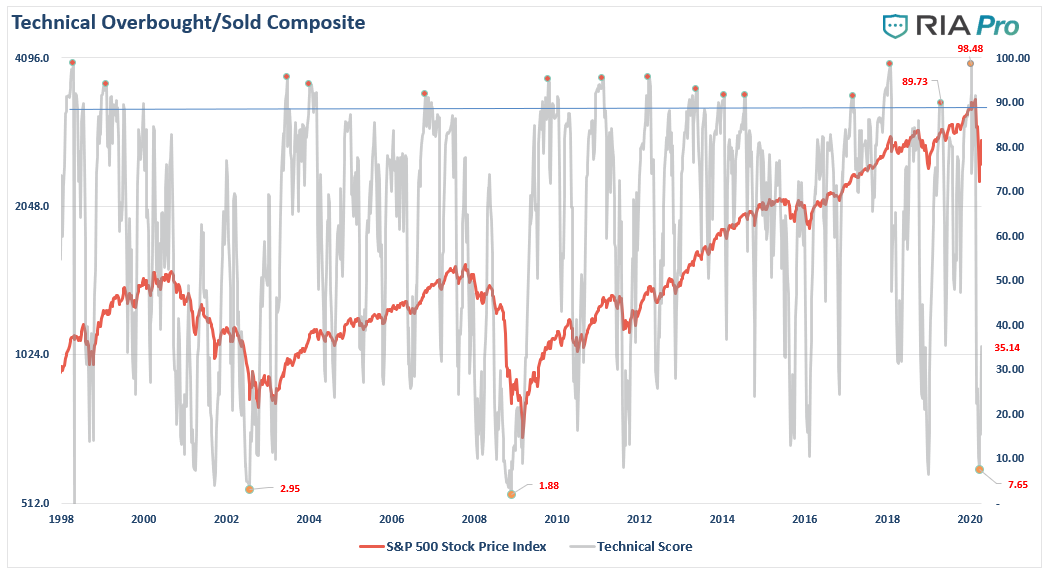
Technical Composite
Note: The technical gauge bounced from the lowest level since both the “Dot.com” and “Financial Crisis.” However, note the gauge bottoms BEFORE the market bottoms. In 2002, lows were retested. In 2008, there was an additional 22% decline in early 2009.
ETF Model Relative Performance Analysis
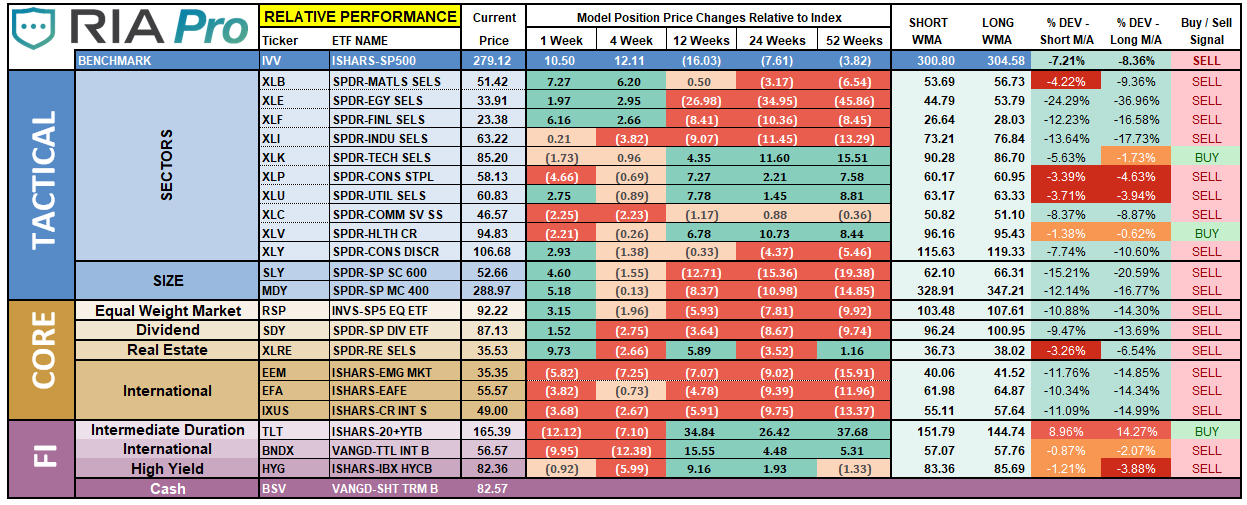
Sector & Market Analysis:
Be sure and catch our updates on Major Markets (Monday) and Major Sectors (Tuesday) with updated buy/stop/sell levels
Sector-by-Sector
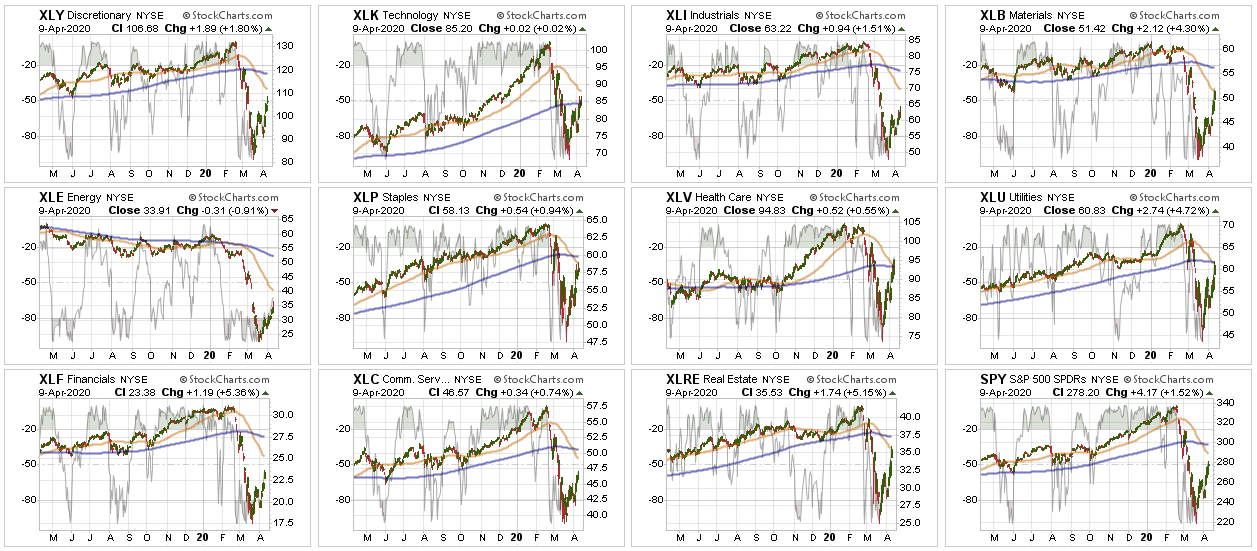
There are no changes to our sector recommendations from last week.
Improving – Discretionary (XLY)
We previously liquidated Discretionary entirely over concerns of the virus and impact on the economy. No change this week. Discretionary is going to remain under pressure due to people being unable to go out and shop, or even when they can; unemployment will pose issues. This sector will eventually get a bid, so we are watching it, but it is way too early to chase the sector right now.
Current Positions: No Positions
Outperforming – Technology (XLK), Communications (XLC), Staples (XLP), Healthcare (XLV), Utilities (XLU), and Real Estate (XLRE)
Two weeks ago, we shifted exposures in portfolios and added to our Technology and Communications sectors, bringing them up to weight. We remain long sectors that are currently outperforming the S&P 500 on a relative basis and have less “virus” exposure. We added a position in Utilities last week, as it regained relative outperformance. We are getting more interested in REITs again, but are going to select individual holdings versus the ETF due to leverage concerns in the REITs.
Current Positions: XLK, XLC, 1/2 weight XLP, XLV, XLU
Weakening – None
No sectors in this quadrant.
Current Position: None
Lagging – Industrials (XLI), Financials (XLF), Materials (XLB), and Energy (XLE)
No change from last week, with the exception that performance continued to be worse than the overall market.
These sectors are THE most sensitive to Fed actions (XLF) and the shutdown of the economy. We eliminated all holdings in late February and early March.
Current Position: None
Market By Market
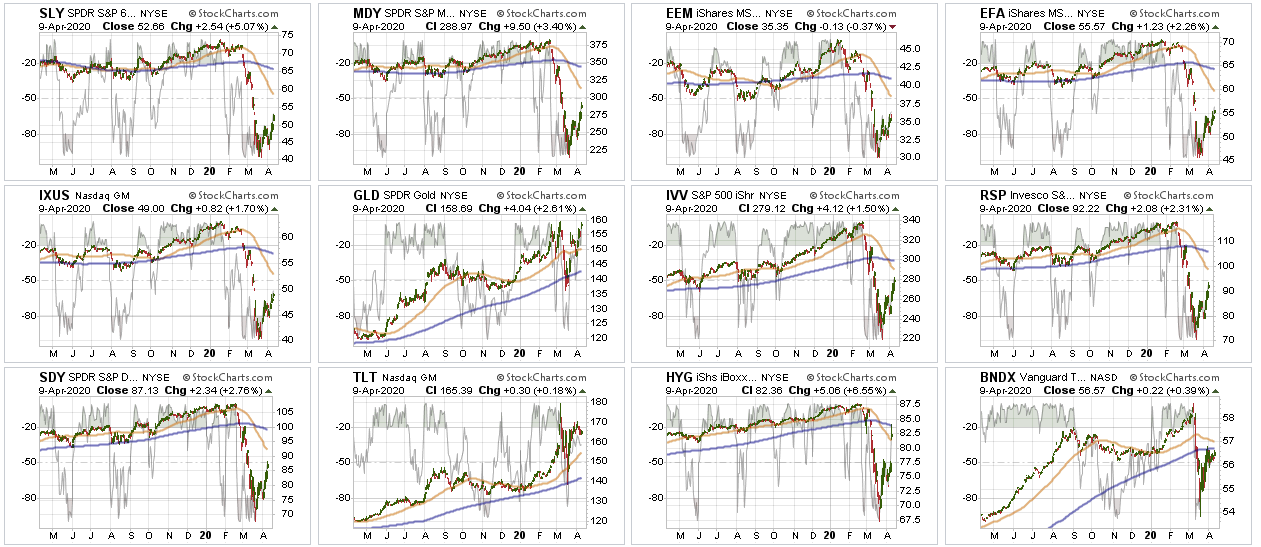
Small-Cap (SLY) and Mid Cap (MDY) – Six weeks ago, we sold all small-cap and mid-cap exposure over concerns of the impact of the coronavirus. We remain out of these sectors for now.
Current Position: None
Emerging, International (EEM) & Total International Markets (EFA)
Same as small-cap and mid-cap. Given the spread of the virus and the impact on the global supply chain.
Current Position: None
S&P 500 Index (Core Holding) – Given the overall uncertainty of the broad market, we previously closed out our long-term core holdings. We will re-add a core once we see a bottom in the market has formed.
Current Position: None
Gold (GLD) – We added additional exposure to both our GDX and IAU positions this past week. With the Fed going crazy with liquidity, this will be good for gold long-term, so we continue to add to our holdings on corrections.
Current Position: 1/2 weight GDX, 2/3rd weight IAU
Bonds (TLT) –
Bonds have rallied as the Fed has become THE buyer of bonds on both a “first” and “last” resort. Simply, “bonds will not be allowed to default,” as the Fed will guarantee payments to creditors. We have now reduced our total bond exposure to 20% of the portfolio from 40% since we are only carrying 10% equity currently. (Rebalanced our hedge.)
Current Positions: SHY, IEF, BIL
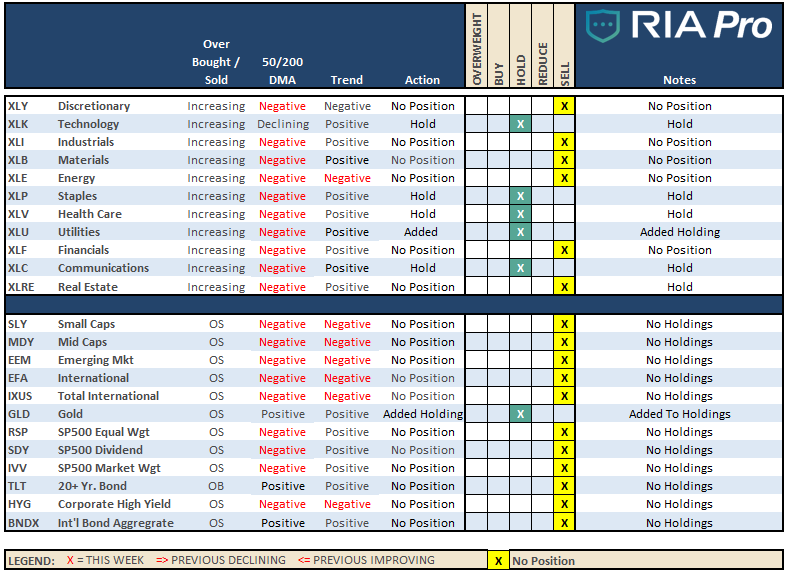
Sector / Market Recommendations
The table below shows thoughts on specific actions related to the current market environment.
(These are not recommendations or solicitations to take any action. This is for informational purposes only related to market extremes and contrarian positioning within portfolios. Use at your own risk and peril.)
Portfolio/Client Update:
Last week, as the market broke out of its consolidation, we removed our short-hedge and added some incremental exposure for the rally. We are likely very close to the end of it, so we are looking to either take profits and raise cash, OR add our short-hedges back for the time being to limit downside risk.
I encourage you to read this week’s missive newsletter in full if you are “getting all bullish” on the market, and think you want more exposure to equity risk.
As noted above, we are only just now starting to see some of the economic damage coming to the forefront:
- 15 million jobless claims
- 20% unemployment is coming.
- GDP will hit “Depression” levels.
- Confidence is on the decline (bad for GDP and stocks)
The impact on earnings will likely be larger than currently expected, which will weigh on markets in the months ahead.
We are down to our core “long-term” equities that we will begin to add to opportunistically as the market bottoms and begins to recover. We have already been working around the edges by adding some Utility exposure, Gold, and Gold Miners this past week.
We will continue to trade opportunistically, but as noted last week, ultimately we WILL MISS the bottom. We are going to wait to clearly see “the bottom” has been put in; then we will aggressively add exposure. At such a point, risk and reward will be clearly in our favor.
We continue to remain very defensive, and are in an excellent position with plenty of cash, reduced bond holdings, and minimal equity exposure in companies we want to own for the next 10-years. Just remain patient with us as we await the right opportunity to build holdings with both stable values, and higher yields.
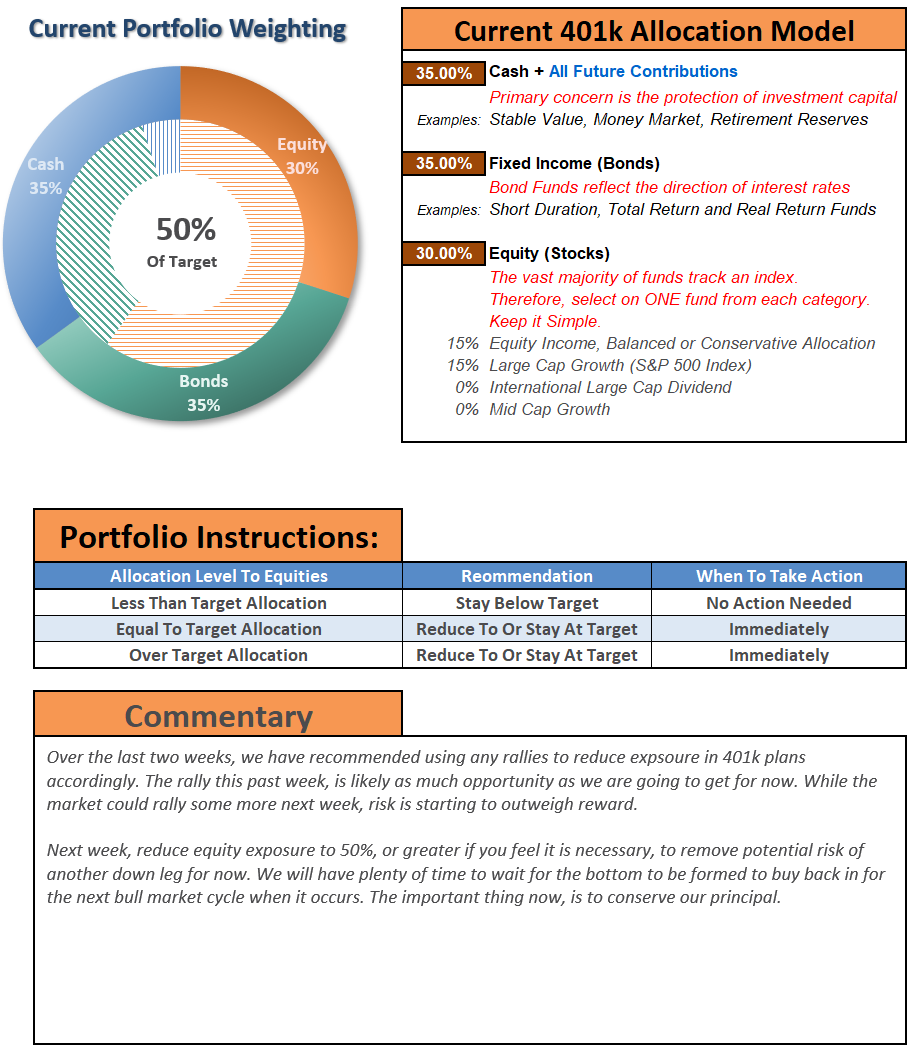
THE REAL 401k PLAN MANAGER
A Conservative Strategy For Long-Term Investors
Model performance is based on a two-asset model of stocks and bonds relative to the weighting changes made each week in the newsletter. This is strictly for informational and educational purposes only and should not be relied upon for any reason. Past performance is not a guarantee of future results. Use at your own risk and peril.
Disclaimer: Real Investment Advice is powered by RIA Advisors, an investment advisory firm located in Houston, Texas with more than $800 million under management. As a team of certified and ...
more

