
Keep An Eye On The Near-Term For Long Bonds
You like bonds? The charts say you could like them even more in the weeks to come. But let’s not get ahead of ourselves.
Long-term bond yields—especially the rate on the benchmark 30-year T-bond—hit fresh lows ahead of the Independence Day holiday. How low? 2.47 percent, a level not visited since 2016.
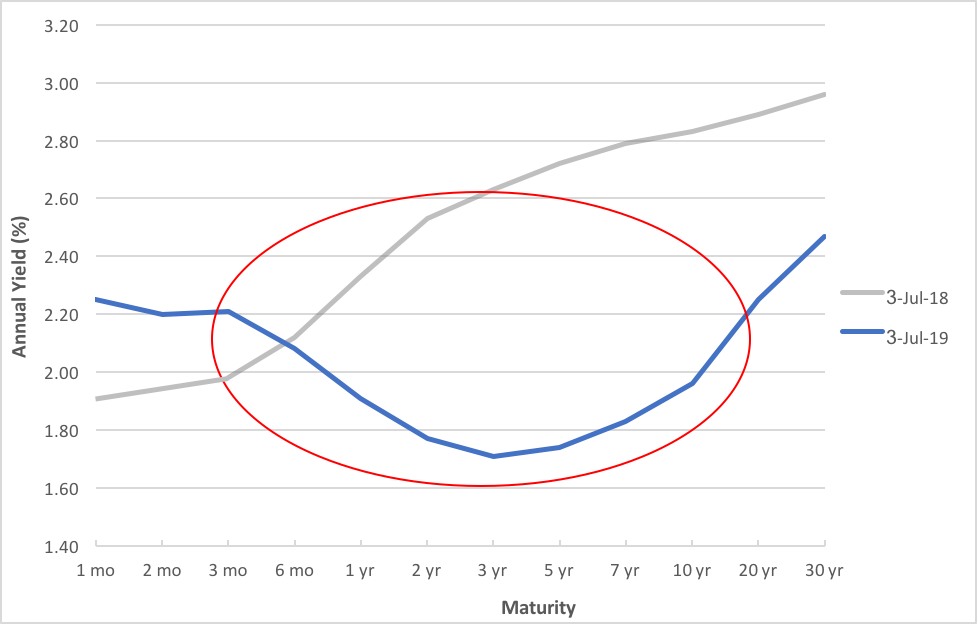
The recent depression in yields isn’t universal, though. The Federal Reserve started snugging up rates last year, making a hash of today’s yield curve. Cast a glance at Chart 1 below. Look what happened over the past 12 months. A year ago, the yield curve (the grey line) was normally sloped. Long-term rates were higher than short rates. Back then, the 3-month T-bill was priced to yield 1.98 percent while 30-year paper paid 2.96. Now, the curve (the blue line) has inverted, at least out to the 3-year maturity. The 3-month bill presently yields 2.21 percent, a jump of 25 basis points from last year. Meanwhile, the 30-year T-bond’s yield has fallen 49 bips to 2.47 percent.
Chart 1 - Treasury Yield Curve
(Click on image to enlarge)
The yield curve’s inversion bespeaks recession concerns going out three years, but that’s a tale for another column. For now, let’s focus on the longer-term debt. The iShares 20+ Year Treasury Bond ETF (Nasdaq: TLT) tracks a market-weighted index of Treasury paper with at least 20 years to maturity and is, by far, the most popular exchange-traded fund for investors trading in the long end of the curve. As bond yields sunk, TLT’s price has risen precipitously. You can trace TLT’s price history in Chart 2.
Chart 2 – TLT Share Price vs. MACD
(Click on image to enlarge)
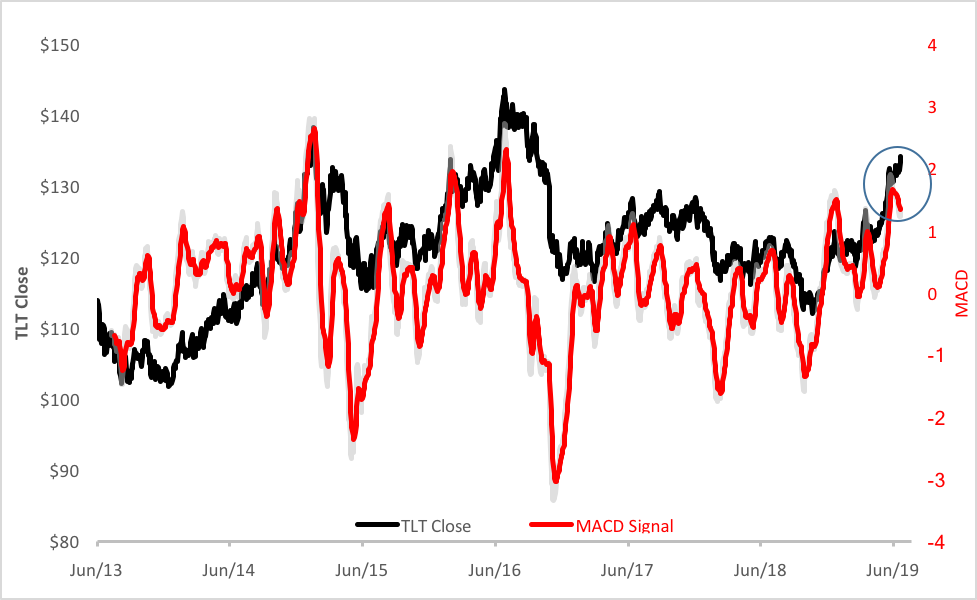
Plotted in red alongside TLT’s price is the ETF’s MACD (Moving Average Convergence Divergence) indicator. MACD represents the relationship between two moving averages – fast and slow – of TLT’s price.
Look inside the blue circle on the right. See how TLT’s price trajectory and MACD are moving in opposite directions? Generally, the MACD and price traces are congruent. Divergences are rare and signal trend changes. It’s the MACD course that controls in this form of analysis, so when MACD heads south while price continues to rise, a bearish turn is predicted, at least for the short term.
And that’s what we see here. A pullback in TLT’s price is likely. That’s not to say that TLT is set to tumble into bear territory. Indeed, the longer-term (60–120 trading day) trend for the ETF is quite bullish. From Wednesday’s close at the $134 level, there are signs that the upward trend, established back in April at $122, has the gas to continue to the $142 level.
The message here for traders? Use pullbacks as buying opportunities for long-duration paper and hang on. Keep an eye on TLT’s price level and this column for further clues.
Disclosure: None.


