
JPMorgan: "A Trump Win Would Constitute A Big Surprise For Markets"
How quickly people forget.
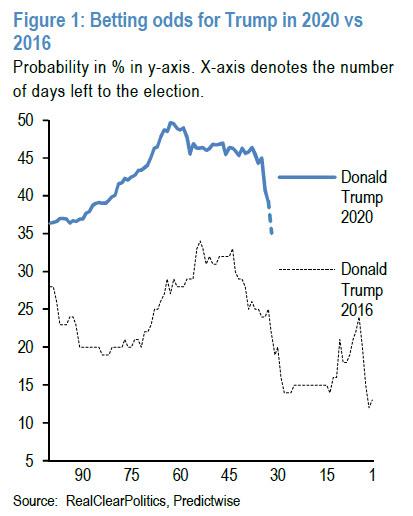
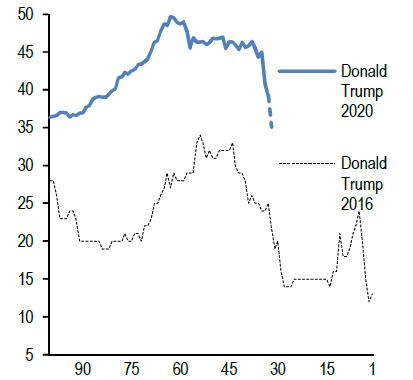
With the narrative across both media and markets driven by the latest polling data turning to the "guaranteed" victory of Joe Biden over Donald Trump on Nov 3, it's worth remembering that exactly this time four years ago, Trump's betting odds to defeat Hillary Clinton were about half where they are now, as the following chart from JP Morgan shows.
But while most have forgotten Trump's dismal polling in 2016, when the NYT declared Hillary's chances of victory at 92% just days before the election, everyone remembers what happened on Nov 8, 2016, even if the NYT and the entire polling industry would like to forget.

And yet, despite this clear lesson from the very recent past that polling and political prediction markets are total garbage, we are going through all the motions again, and as JP Morgan's "other" quant, Nick Panagirtzoglou writes in the latest Flows and Liquidity report, "markets have been factoring in greater probability of Biden winning the election" which naturally "implies that a potential Trump win would constitute a big surprise for markets"... just like in 2016. At the same time, with hopes for a fiscal deal before the election now effectively dead, "a large fiscal package under a Democratic sweep could also constitute a significant surprise for rate markets."
Addressing the main news this week, i.e., Trump testing positive for Covid, the JPM strategist writes that this "news create some uncertainty as, in the scenario where the US President and Presidential candidate gets ill, potential succession issues could be raised on multiple fronts should it prove to be serious."
In response, Panigirtzoglou notes that following this news betting odds for the US election widened even further from this week's debate, with Trump's odds already below 40% on Oct 1st and likely lower today according to preliminary indications, down from 46% a week ago. Of course, as discussed at the top, even with the Friday drop to around 40%, Trump's winning chances are still nearly double the 25% betting odds seen a month before the 2016 election.
Curiously, just yesterday, the "other" JPM quant, Marko Kolanovic laid out a case where Trump's illness could actually boost the president's odds, to wit: "a combination of voter sympathy, turnout and an asymptomatic or mild virus outcome boosts Trump’s election chances (e.g. vindicating his strategy of opening by example)."
In any case, as JPM's Panigirtzoglou writes, the sharp decline in Trump's betting odds over the past week is raising questions about what is priced in across markets. To answer this question the bank looked at various markets to assess whether the market pricing has moved in similar direction to US presidential election betting odds over the past weeks.
Starting with stocks, to gauge how equity markets are positioned, JPM uses baskets constructed by the bank's equity strategists for US equities. In particular, it focuses on the Democratic Agenda Outperformers and Underperformers baskets and the ratioof the two baskets is depicted in Figure 2. It shows relatively flat performance until September. After the tech-led correction in early September, the Democrat Agenda Outperformers have gained 10% relative to the Underperformers baskets, suggesting the US equity markets have been pricing in a higher probability of a Biden Presidency.

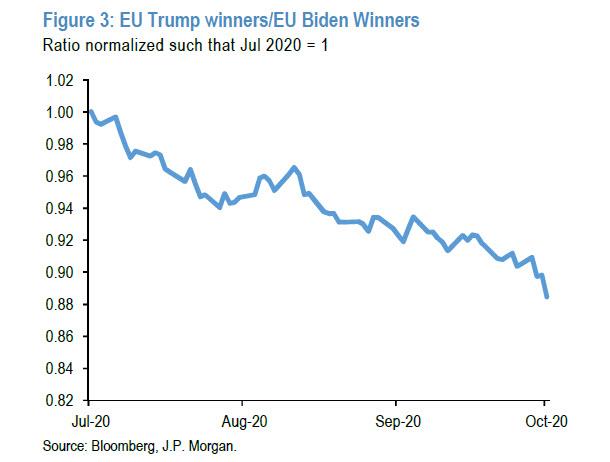
Next, we look at European equities, where JPM again looks at thematic baskets that include companies with higher US sales exposure, ESG underperformers and defense in a European ‘Trump winners’ basket. And the European ‘Biden Winners’ includes companies in the tech (including green tech) and healthcare sectors as well as companies with greater exposure to trade and Asia. These baskets suggest that European equities have also been gradually pricing in a higher chance of a Biden Presidency.
A third way to assess market pricing of a US election is to look at the performance of Asian equities and FX, "given that a continued Trump Presidency would mean further US/China conflict on trade, technology and investments." JPM looks at the Bloomberg JPM Asian Dollar Index (ADXY) as well as the relative performance of the MSCI Asia Free float index vs. the MSCI AC World.
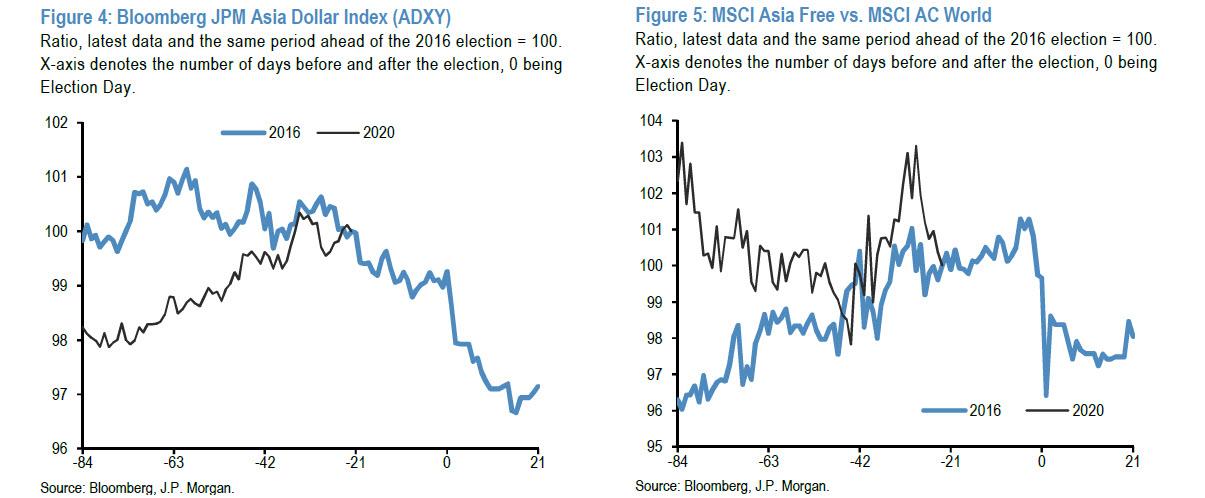
The figures show the performance over the past three months as well as the performance around the same stage ahead of the 2016 election. Both of the charts show that in 2016 the bulk of the reaction came after the election result, consistent with the low odds betting markets were assigning to a continued Trump Presidency outlined above. This year, the charts suggest increased chances of a Biden Presidency up until mid-September, after which there has been some retracement. In other words, after mid-September Asian equities and FX appear to have diverged somewhat from US and European equities that continued to price in a greater probability of a Biden Presidency.
But enough about stocks, what about rate markets? Given the backdrop of continued Fed QE purchases, and that the implications for fiscal policy of a Biden or Trump Presidency under a split Congress are less likely to be significantly different, it is not as clear cut how different market pricing ought to be in either of those scenarios. In other words, when it comes to monetary policy, the name of the US president is completely irrelevant (once again demonstrating that the Fed Chair is far more powerful than the US president).
Indeed, a clear victory by either candidate could reduce uncertainty and hence term premium priced in longer maturity yields. That said, there is a question over how rate markets would react to a ‘Democratic Sweep’ scenario. Recall that Goldman recently predicted a sharp spike in yields in the case of a Blue sweep. However, JPM counters by warning that the immediate reaction could be to add uncertainty given the prospect of changes to tax policy and potentially pushing yields lower.
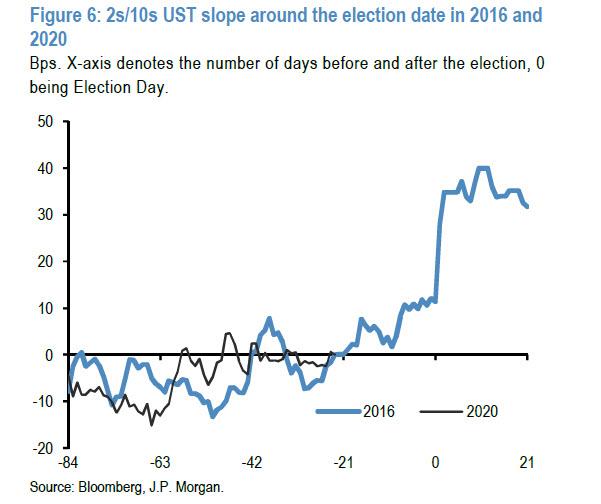
Then again, over the medium term JPM agrees with Goldman, that "the prospect of a significant fiscal stimulus package could add to steepening pressure by adding to the already increased issuance needs of the US Treasury as well as potentially higher inflation expectations via infrastructure spending and minimum wage increases." The chart below shows the change in the 2s/10s slope around the election date in 2016 and in 2020, with 0 representing the current level in 2020 and the equivalent period ahead of the 2016 election.
It shows that in the 2016 election, markets only began to price a prospect of significant fiscal stimulus in the form of then-candidate Trump’s tax cut agenda after the election, consistent with the above.
Putting it all together, JP Morgan find "that markets have been factoring in greater probability of Biden winning the election" just like in 2016. "This implies that a potential Trump win would constitute a big surprise for markets" according to the largest US commercial bank.
Disclosure: Copyright ©2009-2020 ZeroHedge.com/ABC Media, LTD; All Rights Reserved. Zero Hedge is intended for Mature Audiences. Familiarize yourself with our legal and use policies ...
more

