
Is Inflation Or Deflation Coming? Part 2

In Part One of this two-part series, we differentiated between nonmonetary forces pushing up prices as opposed to the monetary forces pushing them down.
We closed with acknowledging that some will say, “Yes, but interest rates have been rising.”
Indeed. Here’s a graph of the 10-year Treasury yield.
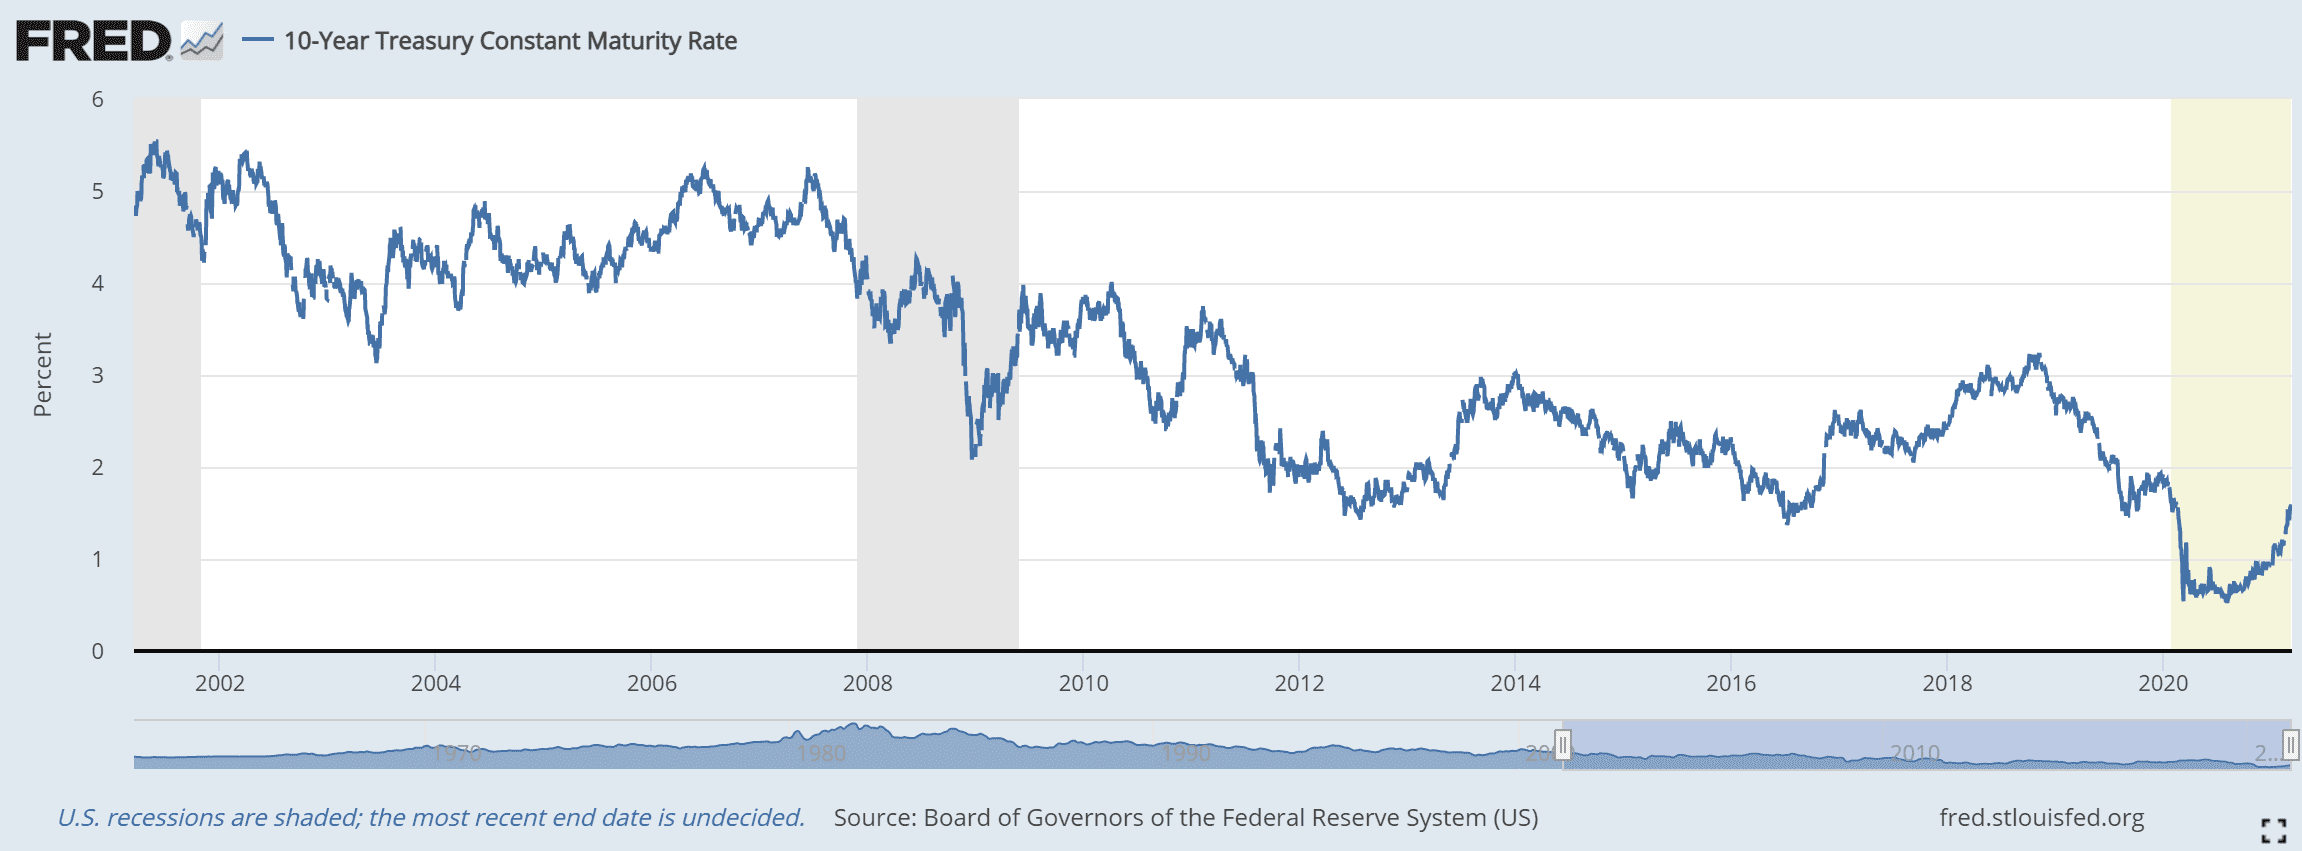
Look at that big move up since August. Back then, the rate was 0.57% and now has hit a recent high of 1.5%.
But let’s put it in perspective. The yield has never been lower than it is now, even after this big move.
The Treasury is not the only interest rate. More germane to the analysis of prices, is the effective interest rate to businesses.
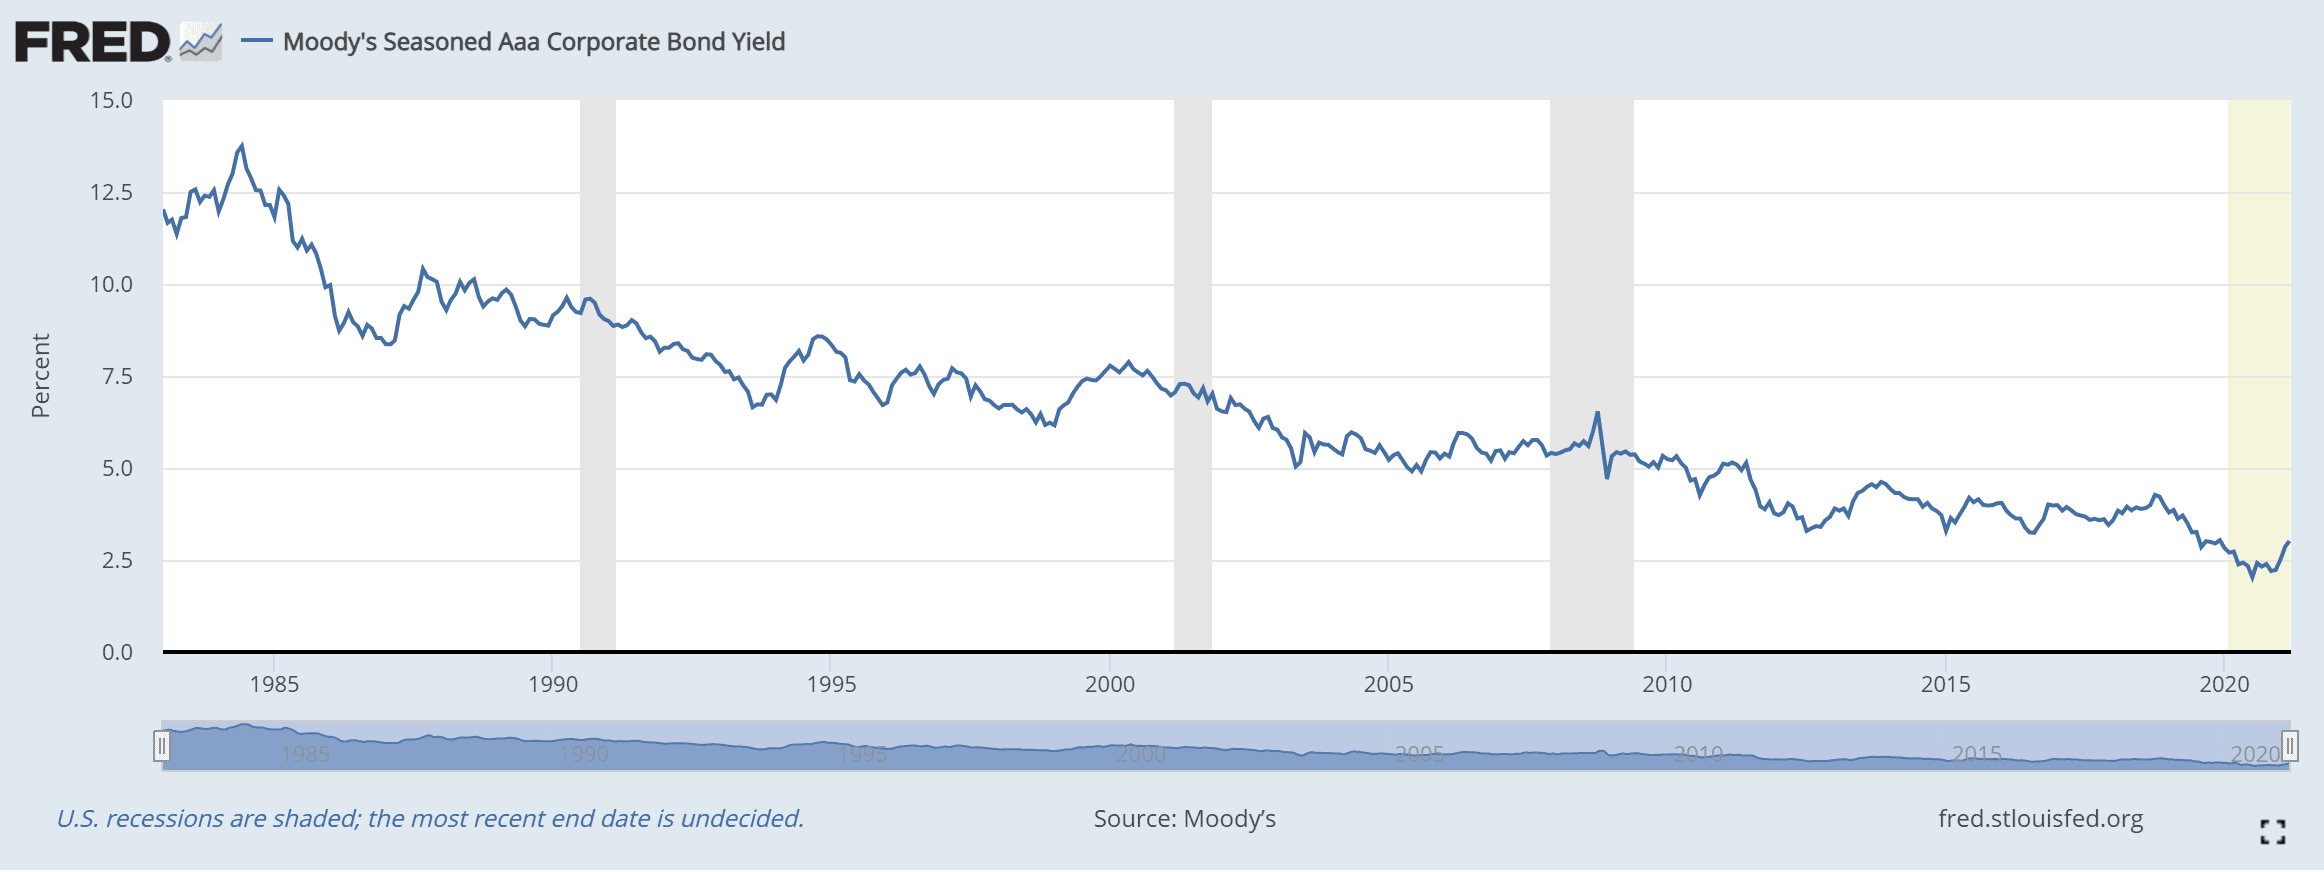
We see a blip up there—to the low achieved just prior to Covid.
Another yield to watch is the earnings yield of stocks, the trailing 12 months earnings divided by the share price. Here is the graph of the S&P 500, showing back to around 1870.
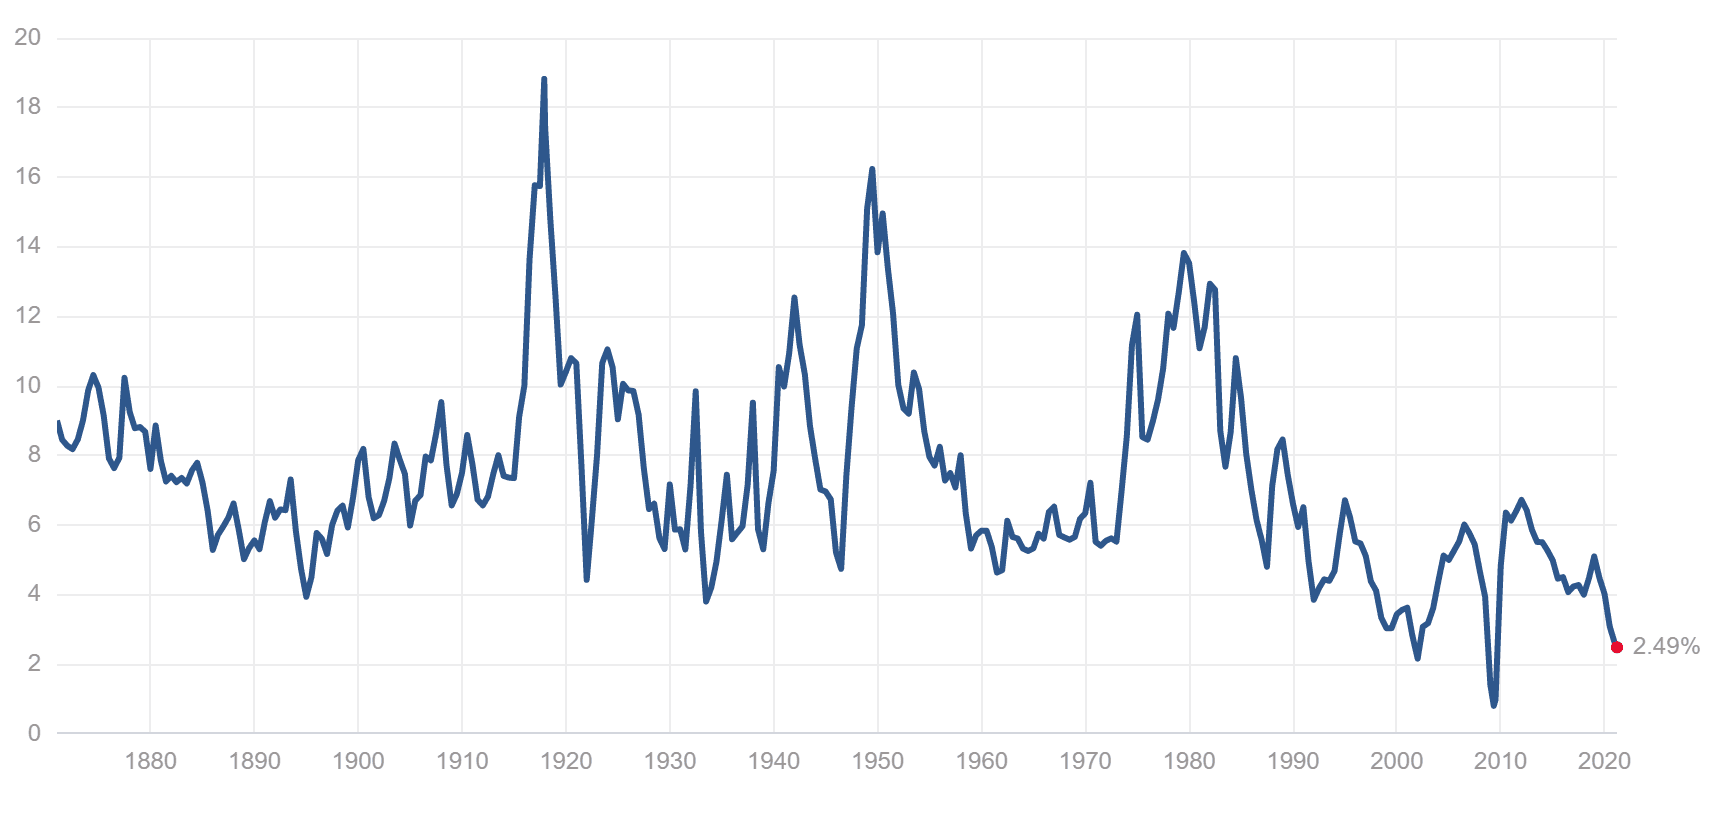
Source: Multipl.com
Other than the brief spike low of the last global financial crisis, the S&P earnings yield has never been much lower. That is important because this is one way of looking at a corporation’s cost of capital.
It’s also a way of looking at the hurdle. The hurdle is the rate of return on capital that an investment must get over, in order for the company to decide to do it.
What Would ACME Corp Do?
For example, Acme Corporation is earning $25 million, and its market cap is $1 billion. In other words, it matches the S&P average (it’s smaller, to keep the numbers simple).
The CEO, Wile E. Coyote, is thinking of selling shares to build more hamburger shops. Assume a store generates $250,000 in annual profit. If it costs less than $10 million to build, he may pursue the opportunity. And doing it will be accretive to earnings. Suppose it costs $5,000,000 to build the store. $250,000 is 5% of $5,000,000. Each store increases Acme’s earnings yield. Or, if the market sets earnings yield at 2.5% due to monetary policy, then Acme’s share price will go up, after selling new shares to finance new stores that generate double the yield of its existing business (along with Mr. Coyote’s annual bonus).
If the earnings yield of a new store is really double that of the earnings yield of their shares, then Acme and its competitors will build a lot of new hamburger stores. Assuming the same thing is true for pizza places, steak houses, and crab shacks, then there will be a lot of capital raised to build a lot more capacity to sell burgers, pizzas, steak, and seafood. This process will continue until either the interest rate (and earnings yield) ticks up, or until they build out so many stores, that profit per store drops to around $125,000.
The $64 trillion dollar question is which of these two scenarios is likely to occur. We hinted at it, in the previous paragraph, with that bit about if the interest rate ticks up.
Ahah! The demand for credit (or in this example equity capital) depends on a falling rate (earnings yield). It evaporates if the rate ticks up! There’s little demand at higher rates! Only at ever-lower rates.
When Does Raising Capital Cease Being Profitable?
There is a connection—arbitrage—between the rate of interest and the return on capital. Businesses will raise capital to grow revenues or cut costs, and keep raising more capital until it’s not profitable any more. Since this profit equals return-rate, then there are two ways raising capital could cease being profitable. One is that return falls. This occurs because each uptick in hamburger supply causes a downtick in the return on capital on hamburger stores. Note that this is not a downtick only on the marginal return on capital. It’s a downtick on all hamburger capital extant. All hamburger restaurants are penalized, not just the ones who borrow to build new stores.
Or two, the borrowing could push up the rate. But in the case of a falling interest rate, the borrowing is from bargain-hunters. They borrow because the rate dropped. They cannot ever drive the rate up, because their business case to open a new store only works at ever-lower rates. They make an ever-lower bid on the interest rate, they do not take the offered rate.
Compare to the environment when rates were rising after WWII through 1981. The profit on carrying more and more inventory for longer and longer periods drove more and more borrowing. That borrowing, was not dependent on ever-lower rates. It was perversely more and more borrowing at higher and higher rates, as those corporations borrowed to chase ever-higher profits in commodity hoarding.
Is there any manufacturer alive today, who would want to increase its holdings of inventory? Much less borrow to finance such hoarding?
Today, we have now seen 40 years of the falling cycle. Companies have all but eliminated inventories, using Lean (aka the Toyota Way) and Just-in-Time delivery. They constantly find ways to become more efficient, to cut costs, to substitute capital for labor, and to expand capacity. It is an environment of falling prices and falling interest rates.
The root cause is when interest is above marginal return on capital.
How else can we interpret the fact that so-called “zombie” corporations (a term used by the Bank for International Settlements) represent over 15% of total corporate debt outstanding? A zombie is a company characterized (by the BIS) as having profits < interest expense. These companies have X amount of capital. A subset of that capital, X-Y, is financed with debt. And the firm’s cost to service this debt is below its return on the total capital of X! The way we formulated it, interest > return on total capital. Which would be X.
So 15% of corporations—if this is the margin, it’s a wide margin—have a return on total capital < interest on the subset of capital that they borrow.
The interest rate drops, which would be good for them. But alas! Each drop has the effect of driving down their return on capital.
Stubbornly Rising Prices
We highlight the difference between monetary and nonmonetary forces to help explain why some prices are sometimes stubbornly rising, despite monetary forces pushing them down. However, even where prices are rising, there is no corresponding rise in per-unit margins nor in return on capital. Quite the opposite, the gas tax, the ethanol mandate, the ADA bathrooms, the supply chain compliance, and many other regulatory assaults on business push profit margins down. A 25-cent hike in gas tax may result in a 23-cent hike in the retail gas price. That means the refiner is making 2 cents less per gallon.
In a rising rates environment, profits and returns are rising. As are profit margins. At least until their plant needs replacement, and then one by one manufacturers close their doors.
In today’s environment, companies must race to get to a bigger and bigger scale, in the hopes of achieving further economies to get per-unit costs down so they can make a penny or two.
It is interesting to compare production of raw commodities to consumer goods, especially consumer goods in single sizes with service attached. In other words, the price of 25,000 pound lots of coffee vs. the price of a mocha latte served in a trendy downtown bakery. This comparison is useful, first because commodity production is usually done by major corporations. And major corporations have the lowest cost of capital. Copper and iron mines, for example, are billion-dollar investments. Also, the impact of regulations is the lowest per unit produced. So commodities show the clearest picture of monetary forces, with the least distortion from regulatory, fiscal, and social policies.
Here is a chart of commodity prices, going back to 1992. The entire graph is within the falling interest rate trend, so does not show the difference from 1947-1981. But it’s as far as the St Louis Fed data series goes back.
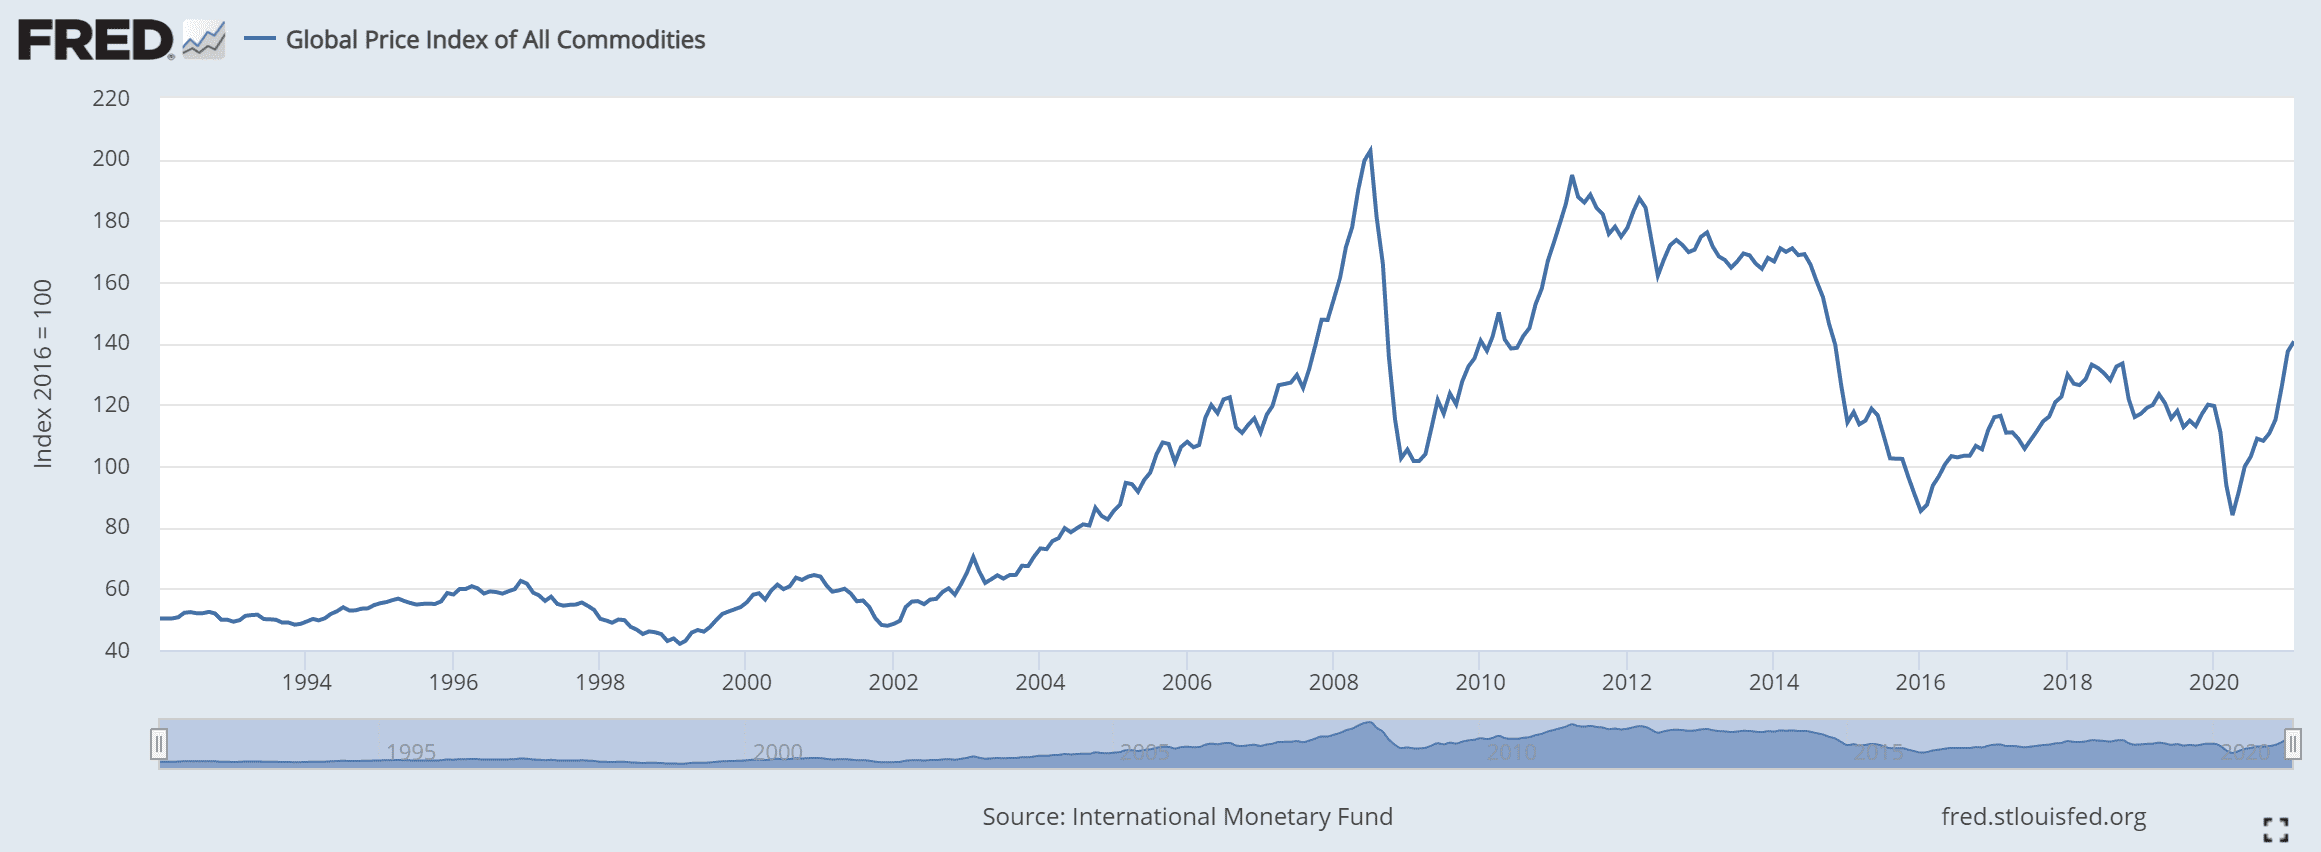
There is no doubt that there has been a recent uptick (corresponding to the uptick in Treasury bond yields). There is also no doubt that it’s been a falling trend since the peak prior to the last global financial crisis. Interest rates were a lot higher than, with the 10-year Treasury around 4%. Zooming out to see the big picture helps smooth out the noise of corrections that inevitably occur along the way.
Not A Theoretical Argument
One might assert that our argument is rather theoretical. To this, we offer two answers. One, it is not the same kind of theory or theorizing of conventional macroeconomics. Look at Paul Krugman in this recent debate video. He talks a lot about choosing the appropriate “framework” to analyze government policy. That is basically an admission that he has multiple theories and whips whichever one out of his pocket that rationalizes his conclusion.
Two, our theory is that people respond to a change in incentives. We can understand the changed response due to endlessly falling interest rates. At each downtick, businesses will invest in projects that didn’t previously make sense. And they thereby lower the return on all such investments going forward.
In other words, we don’t have to listen to a guru like Krugman or a “maestro” like Alan Greenspan to tell us what to think. We can have a solid understanding of what’s really going on in the economy, in business, and in credit and capital markets.
Can there be a temporary race between, say, a building boom fueled by lower interest rates (and mass exodus from the cities, due to social policy) beating the commodities production boom fueled by the same lower interest rates? Yes, of course. Mining companies are slower to respond to a change in the cost of capital than home builders.
But in the end, falling interest will do what it always does. Fuel the expansion of production capacity, and keep fueling it, until the return on capital is marginally above the cost of capital.
In future articles, we will consider the next two questions. One, what, if anything, would break us out of this cycle of falling interest? What could return us to the 1947-1981 rising cycle? Two, if the government is not getting the means to pay for its deficit spending by diluting the currency and its purchasing power, where is it coming from?
Disclaimer: The content in this article is provided as general information and for educational purposes only and should not be taken as investment advice. We do not guarantee the accuracy ...
more

