
Inflation: Some Say It Is A Supply Shock But… Is It?
A supply shock occurs when a lack of inventories is the reason for rising prices. But then inflation would be similar in all regions… and it’s not.
Contrary to Popular Opinion
With the U.S. 10-Year Treasury yield inching higher in recent days, the boom-or-bust economic narrative has the Treasury benchmark on the wrong side of optimism. However, it’s important to remember that the U.S. 10-Year Treasury yield still trades at an all-time low relative to realized inflation.
To explain, I wrote previously:
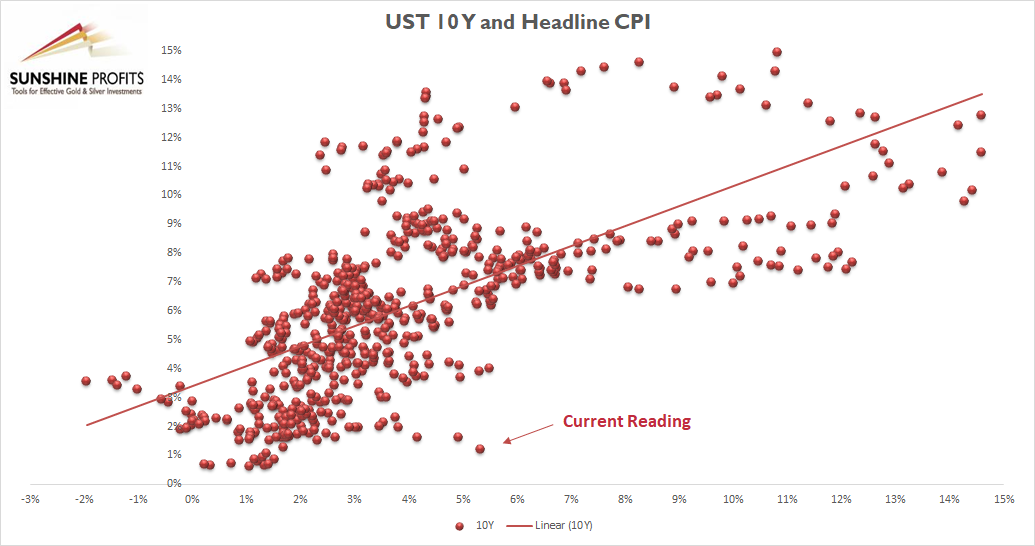
The scatterplot above depicts the relationship between the headline Consumer Price Index (CPI) and the U.S. 10-Year Treasury yield (available data dates back to 1967). For context, the headline CPI is plotted on the horizontal axis, while the U.S. 10-Year Treasury yield is plotted on the vertical axis. If you analyze the dot labelled “Current Reading,” you can see that the U.S. 10-Year Treasury yield has never been lower when the headline CPI has risen by 5% or more year-over-year (YoY). In fact, even if the headline CPI declined to the FED’s 2% YoY target, the U.S. 10-Year Treasury yield at 1.22% would still be the lowest relative reading of all time.
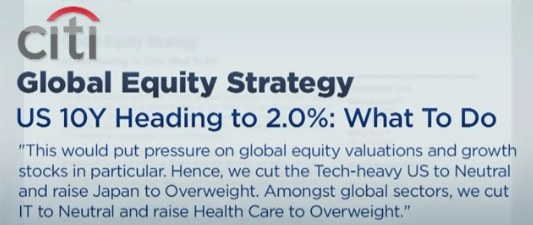
Thus, while investors have left the long end of the U.S. yield curve for dead, Citigroup forecasted a rebirth on Aug. 4. To explain, Citigroup’s rates strategists told clients that the U.S. 10-Year Treasury yield should reach 2% in the coming months.
Please see below:
Tilting the scale, Citigroup noted that Treasury tax collection in June left the federal government flush with cash and resulted in only $94 billion of new Treasury issuance. In the process, with the U.S. Federal Reserve (FED) buying $80 billion of the $94 billion in new notes, distortion prevailed across the Treasury market.
What’s more, Citigroup’s chief U.S. equity strategist Tobias Levkovich told Bloomberg on Aug. 4 that the bank expects interest rate sensitive assets to come under pressure in the coming months. For context, the PMs are highly allergic to rising interest rates. He said:
“Bond yields have had an enormous impact on how you think about growth versus value. Central banks globally have been keeping suppressed rates really since 2008. That suggests they don’t have confidence in long-term, sustainable, durable growth. The U.S. is a heavy growth market. If you believe bond yields are going to edge higher, then growth stocks are going to take it a little bit on the chin.”
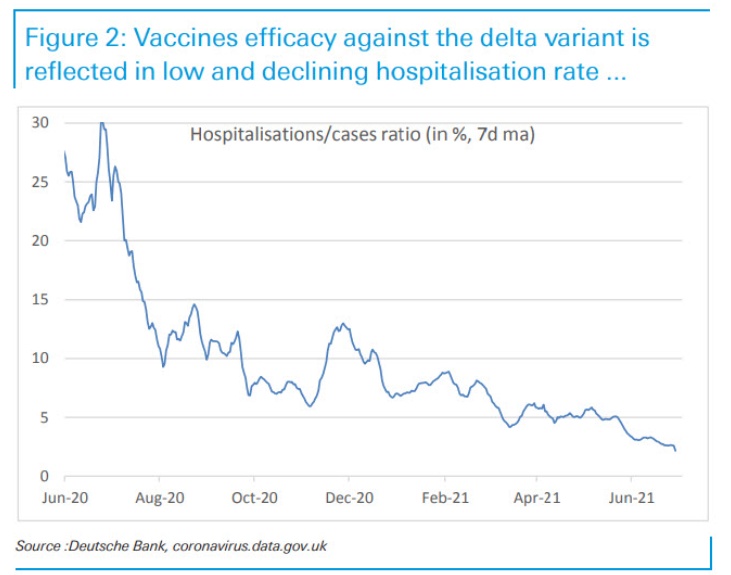
As another factor depressing U.S. Treasury yields, the spread of the Delta variant elicits fears of an economic slowdown. And with the FED’s prospective taper increasing the anxiety, the narrative has shifted to slower growth, lower inflation, and, eventually, a reenactment of the FED cutting interest rates. However, while cases surge and the panic intensifies, U.K. hospitalizations as a percentage of cases (the U.K. has been hard-hit by the Delta variant) have actually declined.
Please see below:
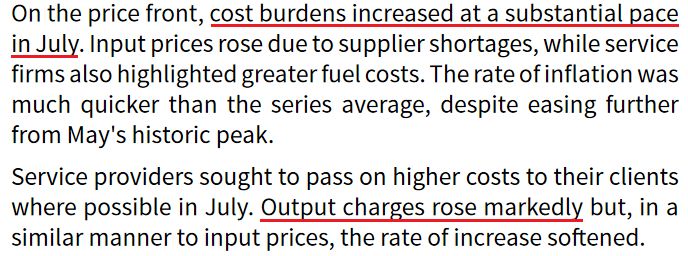
On top of that, IHS Markit also released its U.S. services PMI on Aug. 4. And while the headline index declined from 64.6 in June to 59.9 in July, the report revealed:
“New business continued to rise in July, and at one of the fastest rates since data collection began in October 2009. The upturn was supported by a pick-up in client demand following vaccinations and the relaxation of COVID-19 restrictions. The robust expansion was one of the quickest in over three years despite softening to the slowest since February.”
And while services have been a major laggard – due to coronavirus-related restrictions on social/in-person activity – inflation is still moving higher.
Please see below:
Source: IHS Markit
Circling Back to Inflation
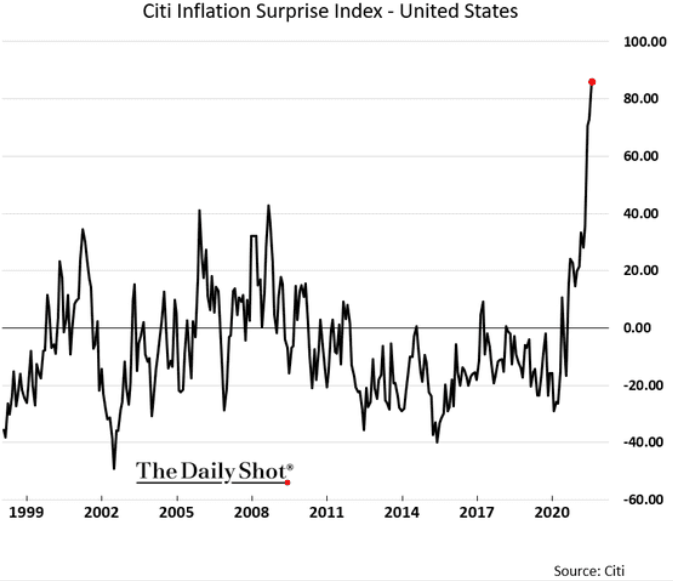
Furthermore, while I’ve warned about rampant inflation for months, Citigroup’s Inflation Surprise Index hit another all-time high in July. For context, a positive ‘surprise’ occurs when actual inflation exceeds economists’ consensus estimate.
Please see below:
Likewise, while S&P 500 companies are in the midst of reporting their second-quarter earnings, conference calls have been riddled with mentions of inflation. Moreover, data from Bank of America highlights just how ‘inflationary’ executives’ rhetoric has been.
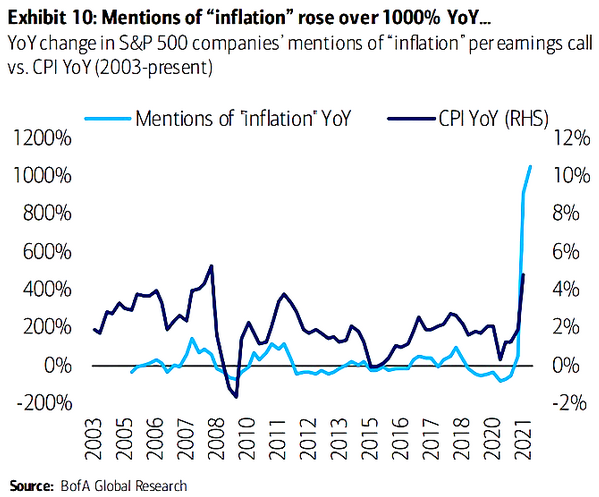
To explain, the light blue line above tracks the year-over-year (YoY) percentage change in S&P 500 companies’ mentions of “inflation” during earnings calls, while the dark blue line above tracks the YoY percentage change in the headline Consumer Price Index (CPI). And though the two lines aren’t fitted to perfection, the behavior of the former is clearly unprecedented.
Adding to the inflationary pressures, S&P 500 companies’ mentions of supply chain inflation and wage inflation have also surged to new all-time highs.
Please see below:
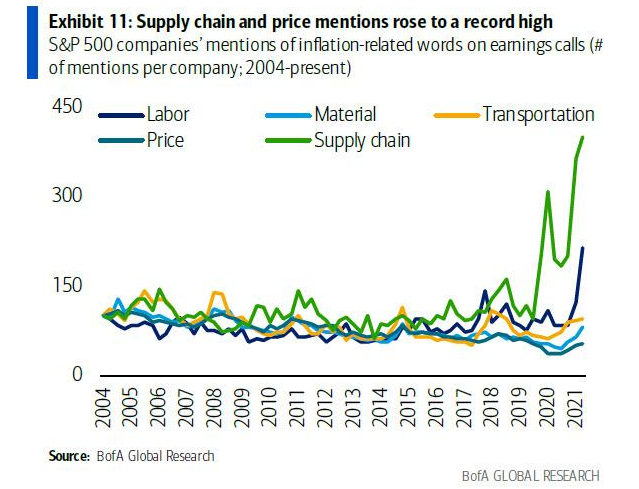
To explain, the green and dark blue lines above track the YoY percentage change in S&P 500 companies’ mentions of supply chain and labor-related inflation. If you analyze the right side of the chart, you can see that the reality on the ground is much different than the one depicted by the U.S. 10-Year Treasury yield.
Supply Shock? Probably Not
Finally, while bond investors price in a doomsday scenario, the inflationary surge is far from a supply shock. For context, a supply shock occurs when depleted inventories are the sole reason for upward pressure on prices. However, if you analyze the chart below, you can see that the countries that are consuming the most finished goods are actually seeing the sharpest increases in output inflation.
Please see below:
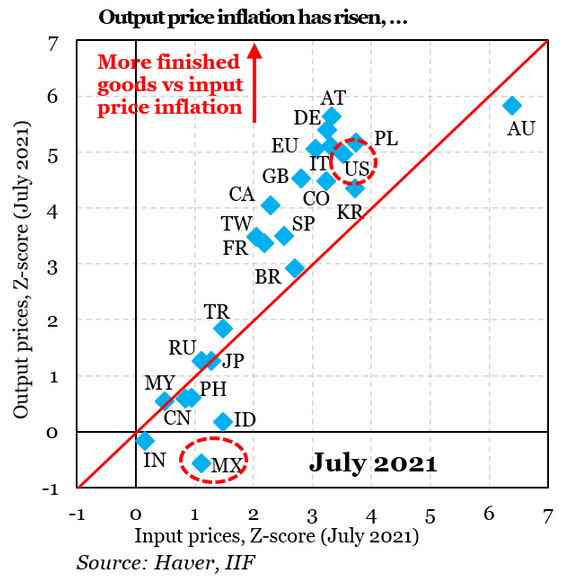
To explain, the blue diamonds above depict the output (and input) inflation experienced in various countries in relation to their consumption of finished goods (calculated as a z-score). If you analyze the trend, you can see that high demand is coinciding with high inflation. For example, if you focus on the U.S. (the red circle near the top), you can see that output inflation is roughly five standard deviations above its historical average, and the demand for finished goods continues to accelerate. Conversely, Mexico’s (the red circle at the bottom) output inflation is roughly 0.5 standard deviations below its historical average and demand remains relatively subdued.
The bottom line? If the inflationary surge was merely a supply shock, output inflation would be similar across all regions. However, with low-demand regions (like MX and IN) unable to pass through input inflation due to weak demand, the U.S. is confronted with a much different scenario. Thus, if Citigroup’s 2% forecast for the U.S. 10-Year Treasury yield proves prescient, the PMs will likely suffer amid the regime change.
In conclusion, gold mining stocks were drastic underperformers on Aug. 5, and rising U.S. equities still weren’t enough to elicit any optimism. And while today’s jobs report (if weak) could uplift their short-term performance, the medium-term forecasts for gold and silver remain clearly bearish. With FED officials ramping up their hawkish rhetoric and the U.S. 10-Year Treasury yield already staring at an all-time low (relative to realized inflation), a reversal of the imbalance could increase the PM’s selling pressure in the coming months. However, because their long-term outlooks remain extremely robust, the PMs’ next leg down will likely present us with a secular buying opportunity.
Disclaimer: All essays, research and information found on the Website represent the analyses and opinions of Mr. Radomski and Sunshine Profits' associates only. As such, it may prove wrong ...
more


There are plenty of groceries, so no shortage there, and lots of gas at the pumps, but all prices are up 5% at least. So that certainly has the smell of inflation. The permanent variety, not transient or transitory, but here to stay.