
How Many Indicators See A Recession?
The chart below supports a point we made in a previous article which is that global GDP growth doesn’t need to fall to the negatives for the economy to be in a recession. As you can see, this chart labels growth below 2.5% as a recession.
(Click on image to enlarge)
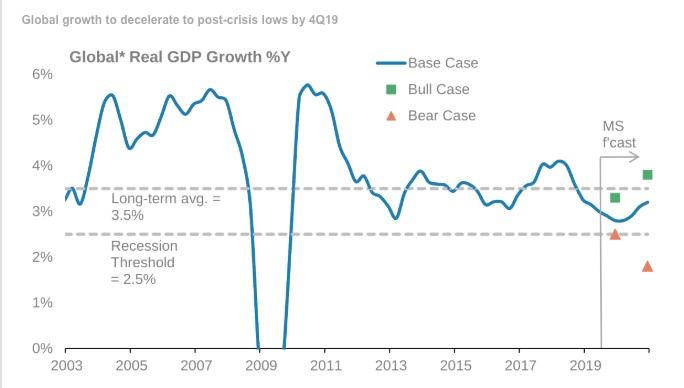
Global GDP growth is very close to the cycle low. Morgan Stanley expects Q4 growth to fall to a new cycle low but then rebound in early 2020 allowing the economy to avoid a recession. Only in the bear case, does the firm see a global recession. The service sector is keeping the economy out of a recession. Less trade uncertainty could help the cyclical economic slowdown from continuing unabated, but that may just be wishful thinking.
Yield Curve Bias
There might be a bias in which investors only follow the yield curve and ignore most economic data. This bias may have been created by the charts that show the percentage chance of a recession in the next year based on the yield curve. There’s nothing wrong with these models, but they may have convinced investors that the yield curve is all that matters. There are few other metrics used alone to forecast recessions. Few people would suggest a decline in corporate earnings means a recession is coming, but the yield curve is so heavily relied upon, some think it’s the only metric that needs to be followed. It gained increased precedence by not calling for a recession in the past 2 slowdowns in this expansion. However, that doesn’t mean it is always correct.
It might not be the best idea to only focus on the yield curve because it has gone a bit rogue. According to Alpine Macro, the term structure of the yield curve is pricing in over a 70% chance of a recession.
(Click on image to enlarge)
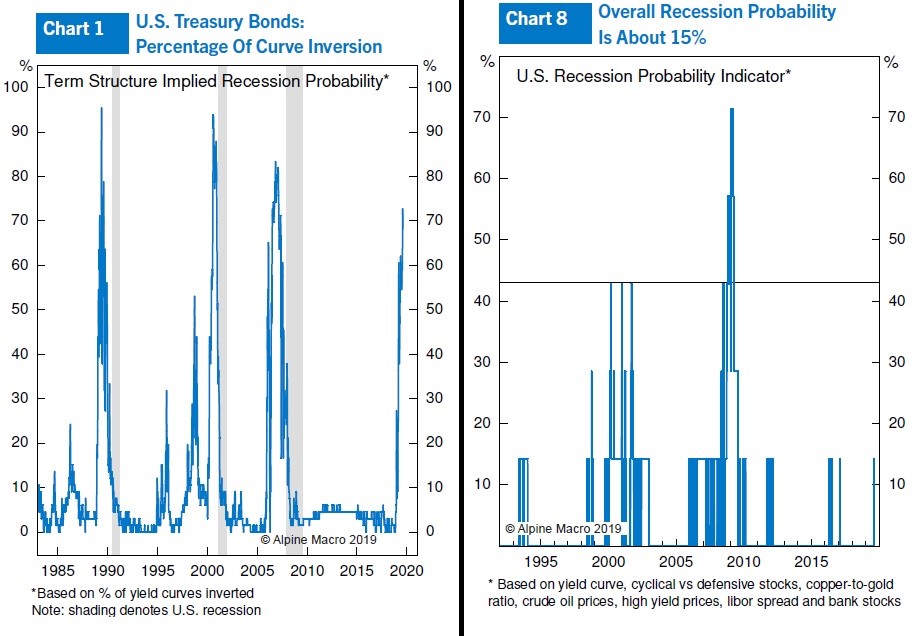
It’s not as high as the previous 3 peaks, but it has never gone higher in the past 35+ years and been wrong. On the other hand, the Alpine model based on the yield curve, cyclical stocks versus defensives, the copper to gold ratio, crude oil prices, high yield prices, the LIBOR spread, and bank stocks shows there is only about a 15% chance of a recession. Those odds have been hit often in the past few cycles without a recession occurring soon afterwards.
Based on Credit Suisse’s Recession Dashboard which includes the yield curve, inflation trends, job creation, credit performance, the ISM manufacturing PMI, earnings quality, and the housing market, only the yield curve is recessionary.
Credit Suisse’s “Recession Dashboard” pic.twitter.com/7HFaLaCybU
— Carl Quintanilla (@carlquintanilla) August 20, 2019
In 5 of the past 6 cycles, there were zero indicators showing expansionary readings. Now there are 4. Here it’s clear the yield curve could be sending an incorrect signal. Additionally, the amount of time the yield curve stays inverted is just as important as the inversion itself. So if the yield curve stays inverted, it’s possible the economy will further slowdown.
Unique Inversion Situation
This has been a weird yield curve inversion. As you can see from the chart below, on average in the past 7 inversions, the short end of the curve has increased above the long end. Now it’s the opposite as the long end fell below the short end.
Inversion insight. Usually short yields jump over the long to invert; this time long fell more than short. AE #DriehausValue pic.twitter.com/TcVfisSLw9
— Driehaus (@DriehausCapital) August 20, 2019
Usually, the Fed hikes rates too much, inverting the curve. Shortly after the Fed hikes rates too much, it stops hiking. At that point it’s too late. The curve normalizes during recessions as the Fed cuts rates, sending down short yields in relation to long yields. This time was different. That’s because the Fed was already cutting when the curve inverted. Did the Fed cut rates early enough to prevent a recession? Is the yield curve inverted because nominal growth expectations are very low and the Fed got overzealous with its hikes?
Big Expectations For Rate Cuts
Somehow, even though the economy isn’t in a recession, the market expects more rate cuts in the next 2 years than it did before and during the financial crisis. As you can see from the chart below, the Fed funds futures market sees another 4 rate cuts in the next 2 years.
Markets are still pricing significant interest rate declines: 4 in the next two years, on top of the one already delivered.
— Bespoke (@bespokeinvest) August 20, 2019
Read more in tonight's Closer: https://t.co/IsRw7uEQKa pic.twitter.com/YFlyZxiJ30
There is a 50% chance the Fed cuts rates 3 more times just by the end of 2019. Why is the market seeing so many rate cuts when the economy isn’t in dire straits? Interestingly, the US economy is the only one out of the G7 nations that has never had a negative monthly Markit composite PMI (below 50) this year. The trade-weighted broad-based dollar index hit a record high (above 2002 peak) even though the market sees 4 cuts coming soon. The global central bank stimulus helps explain why Morgan Stanley sees global GDP growth rebounding in early 2020.
The Latest Research On Tariffs
The tariffs set to be put in place on September 1st and December 15th will have a huge impact on the consumer. As you can see from the chart below, phase 1 and phase 2 had a combined average estimated negative impact of $628 on the consumer.
JPMORGAN: “ .. the average estimated annual tariff cost per household is expected to increase from ~$600 to ~$1,000 with Phase III implementation at a rate of 10%, which would offset majority of the benefit the US households received from the Tax Act (est. ~$1,300).” pic.twitter.com/6L7Q63c39a
— Carl Quintanilla (@carlquintanilla) August 20, 2019
With just the 10% tariff rate in part 1 of phase 3, that impact will increase to $994 per household. Keep in mind that previous phases had a 25% rate. Trump knows how much pain this will cause consumers. That’s why he delayed much of the tariff until December 15th when most holiday shopping is done. The firms with the biggest market caps that have products/services exposed to the tariffs set to go into effect in September are Apple, Boeing, and Nike (all above $100 billion). Apple’s AirPods, HomePod, and Apple Watch are all on the September 1st list. The stocks of the S&P 500 firms hurt by these tariffs are down a median of 11% month to date.
As the JP Morgan chart shows, the full implementation of phase 3 which starts on December 15th, will affect households by another $550, bringing the total to $1,544. That’s bigger than the $1,300 benefit from the tax cut. The $100 billion firms exposed to part 2 of phase 3 are Apple, Cisco, and Nike. In this part, Apple’s biggest product, the iPhone, will be significantly impacted by the tariffs. The stocks of the S&P 500 firms hurt by these tariffs are down a median of 9% month to date.
Conclusion
The yield curve is one of the only indicators signaling a recession is coming. Even so, the market sees another 4 rate cuts coming in the next 2 years. 3 of those cuts might come by the end of 2019. The next round of tariffs starting in September will have a major impact on the consumer. If we get to December 15th without a trade deal, the impact will be even worse. Consumers are smart. If they see a tariff coming, they might buy products beforehand. A temporary boost in retail sales in November, in this case, isn’t ideal. On the other hand, the uncertainty created by the trade war might cause consumers to pull back even before the tariffs are implemented.
Disclaimer: Please familiarize yourself with our full disclaimer here.


