
How Long Can This Short-Term Uptrend Last?
The Short-Term Trend
The short-term uptrend continues. Except for one brief blip, this PMO index has nailed the uptrend. It's a reminder for me to focus on the indicators and to remain open-minded regarding market-outcomes. In other words, the market can remain in a short-term uptrend much longer than expected.
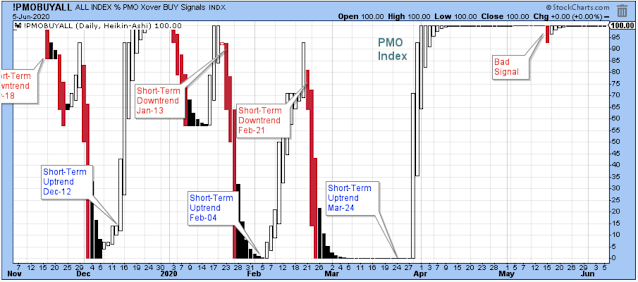
This basic, short-term moving average cross over technique also nailed it, and continues to nail it. More lessons. Simple is often better.
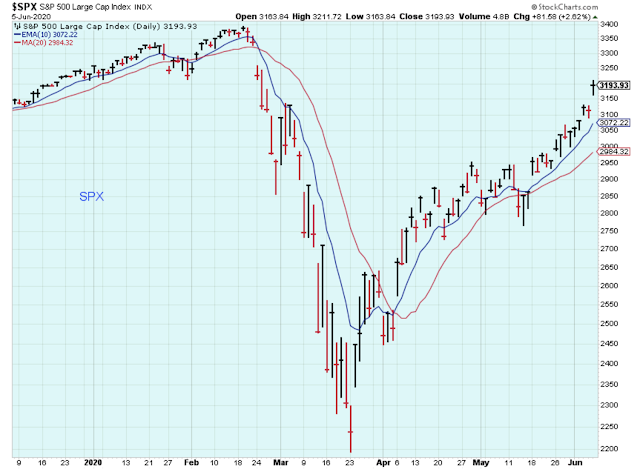
So, how much longer can this short-term uptrend last?
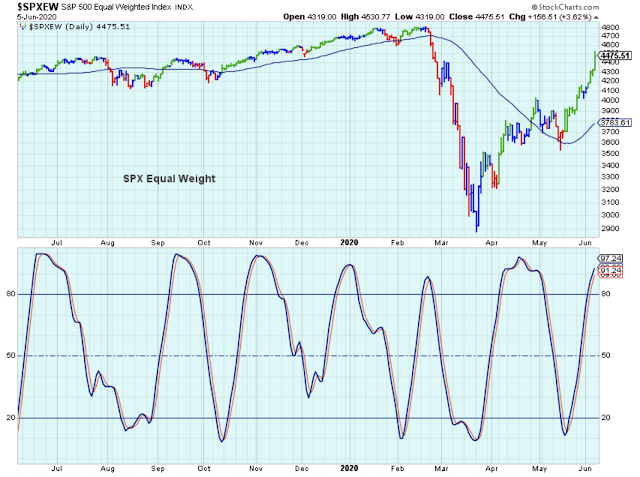
The stochastic shown below is another way of looking at the short-term, and this indicator says that there was actually a brief downtrend that started late-April and finished mid-May. Now, the stochastic is at the top its range, which I think is the signal to start looking for signs of market weakness, or maybe, in this case, to look for signs that the market is too extended, short-term.
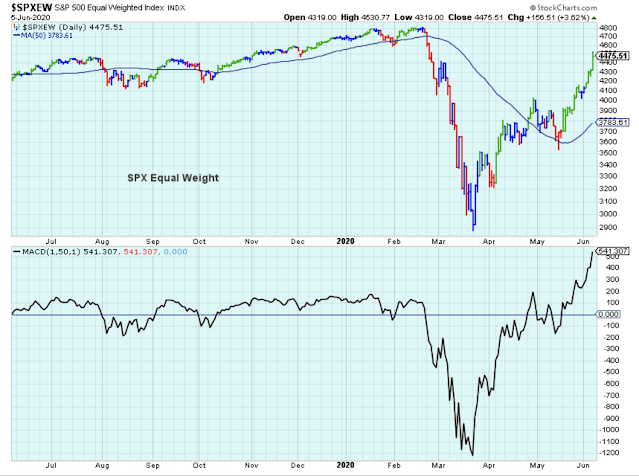
Here is another look at the same index, but with a technique that John Murphy uses to determine how extended the index is over its 50-day average. He adjusts the MACD to a "1,50,1" setting, so that you can see how far the one-day average is above the 50-day average, and, at the moment, its a bit too far above.
Although, the index is reacting to the March selling where the MACD was way too far below. You have to decide for yourself because I'm not certain, but I do think that it is extended enough to say that this isn't the time to be buying. Side note: When the market looks too oversold or too overbought (extended), I think a good technique to use a five-day average.
The ten-year yield started to rise on Wednesday, June 3. It seems as though there were plenty of bond market investors who were selling Treasuries because they were optimistic that the jobs report would be a lot better than expectations. How did they know?

This is interesting. Despite the strong rally in growth stocks that started in March, this ETF is still below its 200-day. So what is happening here? I think this recent underperformance is a reaction to the rising ten-year yield.
Small-Cap growth stocks do not like higher rates, whereas small-cap value stocks like higher rates. Rising rates tend to compress PE ratios, and this puts downward pressure on growth stock prices. Also, there are lots of regional banks in small-cap value and these benefit from broadening yield spread as the ten-year yield rises, and this puts upward pressure on their stock prices.

Outlook Summary
I do my best trading when I am patient and disciplined.
- The medium-term trend is lower, as of February 26.
- The short-term trend is up, as of March 24.
- The economy is in recession, as of March 28.
- Contrarian Sentiment is not certain, as of June 6.
The medium-term trend for Treasury bonds is up, as of January 25 (prices higher, yields lower).
Disclaimer: I am not a registered investment adviser. My comments above reflect my view of the market, and what I am doing with my accounts. The analysis is not a recommendation to buy, ...
more

