
How High Are Interest Rates Heading?
10-year Treasury yields jumped in the first quarter from 0.92% to 1.75%, resulting in the worst quarterly performance for bonds in more than 40 years, explains Marvin Appel of Signalert Asset Management.
This month, yields have settled down to the 1.6% area even as inflation heats up. In deciding how to manage your bond investments it can be helpful to develop an interest rate outlook. In this article, I will review the multi-decade history of how interest rates compared to inflation and GDP growth to give you an idea of how overvalued bonds remain and what the upside potential for interest rates might be in the years ahead.
10-Year Treasury Note Yield and Inflation
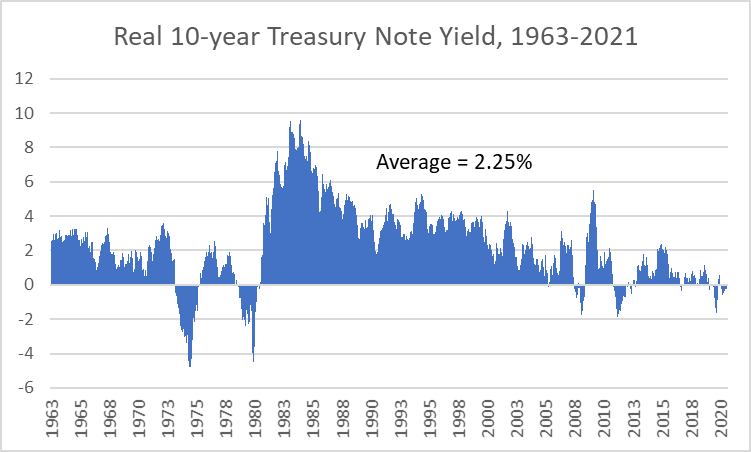
The chart below shows the long-term history of real 10-year yields, which is the 10-year Treasury yield minus the trailing 12-month percentage change in the consumer price index. The historical average real yield has been 2.25%. That means that if the Federal Reserve manages to keep inflation at its 2% target, a historically typical yield on 10-year Treasury notes would be 4.25%.
However, real yields have varied widely. In the 1970s, real yields reached very negative levels as inflation spiked. The bond market’s reaction in the form of very high interest rates in the early 1980s generated a golden age for bond investors, with real yields well above average for most of the 1982-2003 period. However, since 2010 real yields have been paltry most of the time, particularly in 2020.
Assuming that we are in for a prolonged period of modest (but positive) real yields, say 1%, and that inflation does average 2%, it seems reasonable to expect 10-year Treasury yields to continue their climb until they reach at least 3%.
10-year Treasury Note Yields and GDP Growth
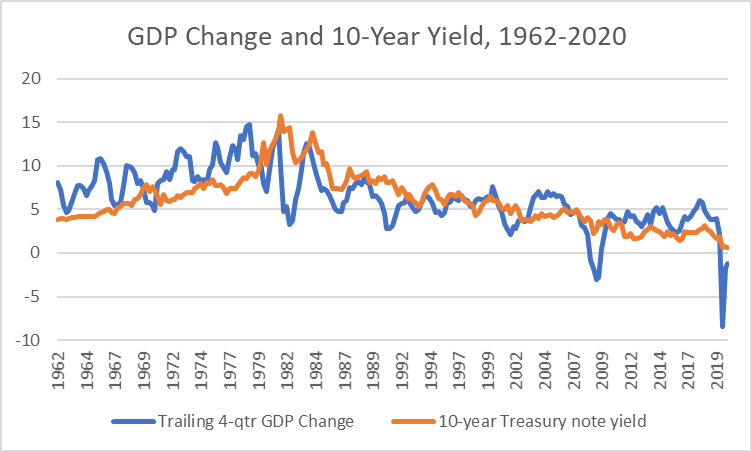
A widely cited rule of thumb is that the 10-year Treasury note yield is fairly valued when it is roughly equal to the rate of nominal GDP growth. The chart below shows how well GDP growth and Treasury yields have tracked each other. It has been the case that over multi-year time frames, GDP growth and yields have moved in parallel. However, GDP growth is much more volatile than interest rates, so the data in any given year are likely to be very divergent. 2020 is a prime example: GDP contracted but 10-year Treasury note yields remained above zero. In 2021 the economy is expected to grow by at least 8% (6% headline GDP growth projection plus 2% inflation), and of course 10-year Treasury yields are nowhere near 8%.
Assuming real GDP growth of 1%-2% over the long term, and inflation of 2%, the implied fair value for 10-year Treasury note yields should be in the 3%-4% range, consistent with yield projections based on inflation alone.
3-Month Treasury Bill Yields and Inflation
It seems hard to imagine now with money market yields at zero for most of the past 12 years, but Treasury bills used to be a reasonable risk-free inflation hedge in the 1960s, 1980s, and 1990s. The chart on the next page shows the real three-month Treasury bill yield (T-bill yield minus trailing 12-month change in the Consumer Price Index) since 1963. As with 10-year Treasury note yields, real T-bill yields were positive in the 1960s, negative in the 1970s, and strongly positive in the 1980s and 1990s. Since 2003, however, real three-month T-bill yields have been negative most of the time.
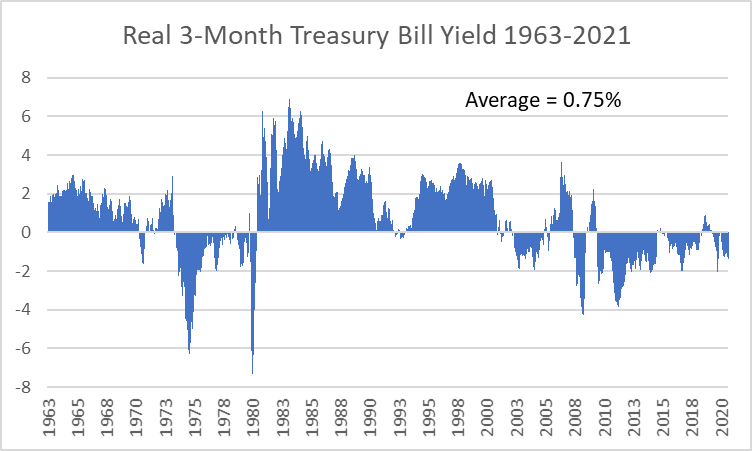
The Federal Reserve has stated its intention of leaving the Fed Funds Rate alone for at least two more years even if inflation exceeds its usual 2%/year target. (The Fed Funds Rate and three-month Treasury bill yields track each other closely.) This implies real T-bill yields of below -2% for at least two more years. However, if we view the long-term historical average real yield of +0.75% as a reasonable future target, eventually T-bill yields should get to the 2.75% area.
Implications
Based on historical standards, Treasury notes and Treasury bills are very overvalued. Even though rates have been stable in April and the Federal Reserve is happy with where yields are now, over the years ahead it is reasonable to project that yields will rise until they retest the highs of 2018, the last time that real interest rates were at normal levels. I do not expect any such retest imminently but would not be surprised to see 10-year yields make their way back to 2018 levels (3%-3.25%) over the next two years.
The rise in 10-year Treasury note yields so far in 2020 has been orderly in the sense of not triggering any significant market corrections or economic consequences. The best scenario would be for the markets to repeat this outcome.
I take the Fed at its word that it will not increase short-term rates until the markets force its hand. The implication is that investors should not commit to long-term bonds (or to fixed lifetime annuities) until 10-year yields touch 3%. Instead, more tactical strategies such as trading high yield or floating rate bond funds are more appealing. Investment-grade bond investments should be in mutual funds that are more tactical or which utilize asset-backed bonds to take advantage of higher yields, such as Double Line Total Return (DLTNX).
When Will the Fed Make Its Move to Raise Short-Term Interest Rates?
That is the $1 million question. Although I cannot predict when the Fed will be forced to tighten, the bond market will probably give notice some weeks in advance.
The chart below shows the Federal Funds Rate (what the Federal Reserve sets at its Open Markets Committee Meetings every six weeks) and the two-year Treasury note yield (which reflect market prices) from 1976-2021. In many instances (circled), the two-year Treasury note yield changed direction shortly before the Federal Reserve did.
So if you want some clue for when the Federal Reserve might be ready to boost the Fed Funds Rate up from the 0-0.25% range you can follow the yield on two-year Treasury notes (currently 0.16%). A bump to 0.4% or higher will likely be a harbinger of the Fed’s first rate hike.
Note that CPI is not available in real-time, but instead with a lag of approximately two weeks.
Disclaimer: © 2021 MoneyShow.com, LLC. All Rights Reserved.


