
Gold, USDX: The Board Is Set, The Pieces Are Moving
A culminating point has been reached. With the USD Index being backed up by solid fundamentals, can gold hold the line?
Have you ever noticed how often the language of war is used in finance and economics articles? A given company is on the defensive or the offensive, a stock is pushing forward, something else is rallying, positions are being taken… who will fire first? It’s the case of continuous push and pull factors that make military strategies and concepts relevant to the subject of money.
Now, when it comes to gold and the USD Index, it’s not the great battle of our time (in reference to today’s title), as Gandalf explained to Pippin in The Lord of the Rings, but it’s a battle, nonetheless. For the yellow metal, it could even be a deep breath before the plunge. We’ll soon find out.
With an epic struggle for supremacy set to unfold in the coming weeks, battle lines have officially been drawn: with the USD Index hovering near its 50-day moving average and gold recapturing its 50-day MA, negatively correlated assets have officially collided. And, as the rules of engagement specify that to the victor go the spoils, which one is likely to wave the white flag?
Well, with the USD Index built on a foundation of relative fundamentals and gold a beneficiary of shifting sentiment, the former remains locked and loaded and poised to neutralize the threat. Case in point: despite the USD Index’s recent recoil, non-commercial (speculative) futures traders actually increased their net-long positions last week.
Please see below:
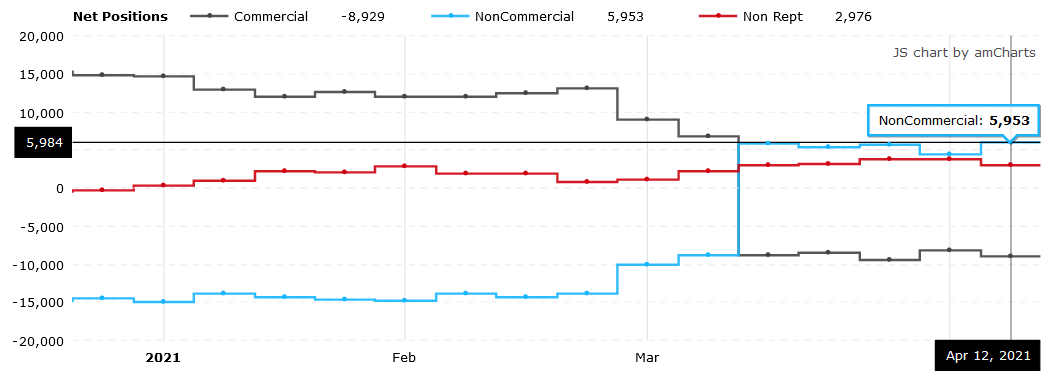
Source: COT
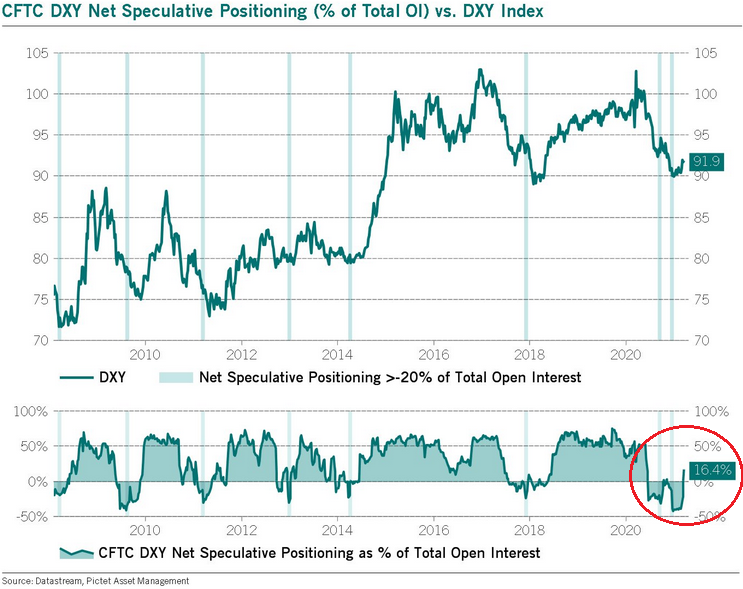
Moreover, let’s keep in mind that when net-speculative short interest as a percentage of total open interest (based on the CoT data) became extremely high in 2014 and 2018, the USD Index recorded two of its sharpest rallies in history. How sharp? Well, let’s take a look at how things developed in the past – after all, history tends to rhyme.
Let’s focus on what happened when the net speculative positions were significantly (!) negative and then they became significantly (!) positive, without paying attention to tiny moves (like the one that we saw last summer).
In short, rallies that began with extreme pessimism include:
- The big 2008 rally (over 16 index points)
- The big 2009 – 2010 rally (over 14 index points)
- The 2011 – 2012 rally (over 11 index points)
- The 2013 rally (“only” over 5 index points)
- The big 2014 – 2015 rally (over 20 index points)
- The 2018 rally (over 15 index points)
The current rally started at about 89, so if the “normal” (the above shows what is the normal course of action) happens, the USD Index is likely to rally to at least 94, but since the 5-index point rally seems to be the data outlier, it might be better to base the target on the remaining 5 cases. Consequently, one could expect the USD Index to rally by at least 11 – 20 index points, based on the net speculative positions alone. This means the upside target area of about 105 – 114. Consequently, a comeback to the 2020 highs is not only very likely but also the conservative scenario.
In addition, let’s keep in mind that the very bullish analogy to the 2018 rally remains intact. If you analyze the chart below, you can see that back in 2018, the USD Index rallied sharply and then corrected back to its previous highs. And in a similar fashion, the current weakness is nearly identical. More importantly, though, with the 61.8% Fibonacci retracement level sitting just below the USD Index’s 50-day MA, the cavalry is already on the way.
Please see below:
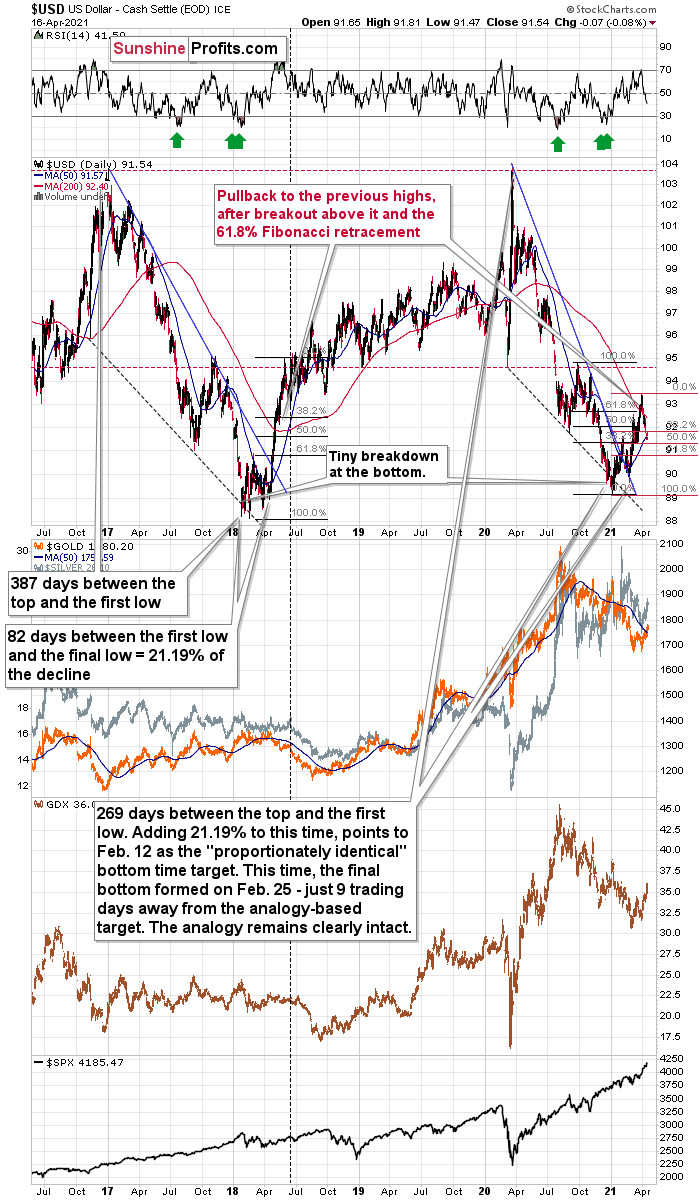
The current correction is much bigger than what we saw in mid-April 2018, so it seems that what we see right now is more of an analogy to what we saw in June 2018. That was the first big correction after the breakout – above the 50-day moving average and the declining blue resistance line – that definitively ended the yearly decline.
I marked the situation from 2018 that seems similar to what we see right now with a dashed, horizontal line. Back in 2018, the pullback ended when the USD Index moved to its first Fibonacci classic retracement level (the 38.2% one). In the case of the current rally, I marked those retracements with red. The USD Index is already below the first two (taking today’s pre-market decline into account) and it seems to be on its way to reach the final – most classic – 61.8% retracement. This kind of retracement provides substantial short-term support and it’s something that’s likely to trigger a rebounding.
This retracement is slightly above the 90.7 level, and at the moment of writing these words, the USD Index is trading at 91.14. This means that the USD Index can reach its very strong short-term support any day – or hour – now.
The very important detail about the June 2018 decline (and bottom) is that while this was the moment after which the USD Index’s started to move higher at a slower pace, it was also the moment after which the precious metals market started to decline faster.
At the beginning of the year, I wrote that the precious metals market was likely to decline and that the preceding rally was likely fake. That’s exactly what happened.
Right now, I’m writing that the recent rally was also fake (a correction within a medium-term decline) and – even more importantly – it seems likely that the next downswing could take place at a higher pace than what we saw so far this year. And – just as was the case in 2018 – this upcoming (fast) decline is likely to lead to the final bottom in the precious metals sector.
Of course, just because the bottom is likely to be formed in the following months, doesn’t mean that it’s in at this time or that it’s a good idea to ignore the bearish implications of the situation in the USD Index (as well as other indications pointing to lower gold prices).
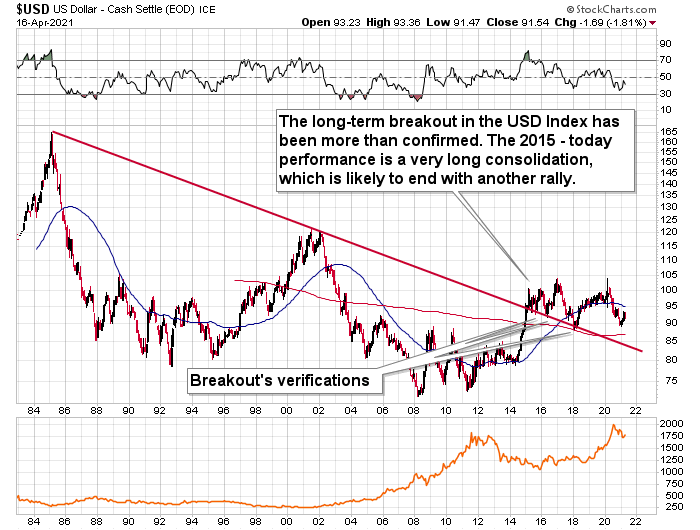
As further evidence, the USD Index’s 2020 decline has not invalidated its long-term breakout. And with the long-term implications taking precedence over the medium- and short-term ones, the USDX still has its guns pointed in the right direction.
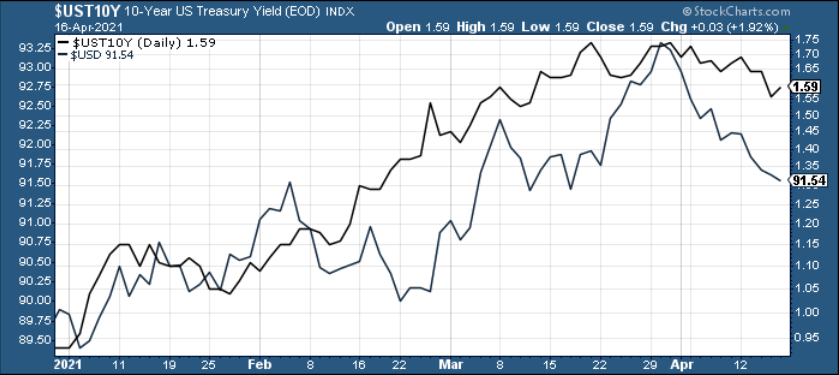
Adding reinforcements to its infantry, the USD Index also has another ally in the U.S. 10-Year Treasury yield. After sitting out much of the rally in 2020, the former has been following in the latter’s footsteps since New Year’s Day. And while the U.S. 10-Year Treasury yield’s frailty has been negative over the last two weeks, the dynamic could be about to flip.
Please see below:
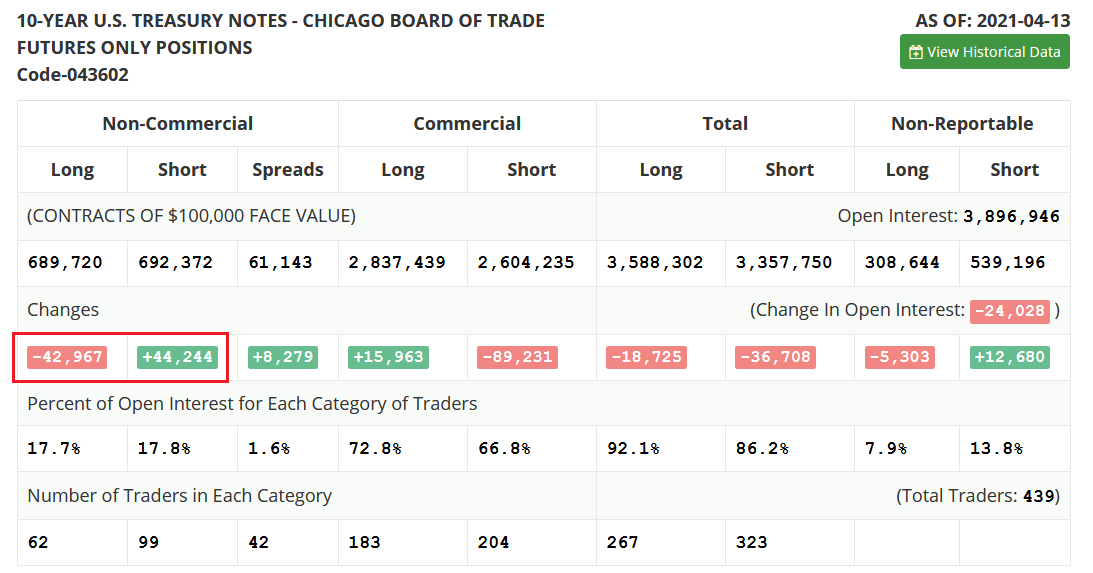
Trending in the opposite direction of the USD Index futures, non-commercial (speculative) futures traders have moved from net-long to net-short the U.S. 10-Year Treasury Note. For context, bond prices move inversely of yields, so a lower U.S. 10-Year Treasury results in a higher U.S. 10-Year Treasury yield. And after non-commercial (speculative) futures traders reduced their long positions by nearly 43,000 contracts and increased their short positions by more than 44,000 contracts, speculators went from being net-long nearly 84,600 contracts to net-short nearly 2,700 contracts.
Please see below:
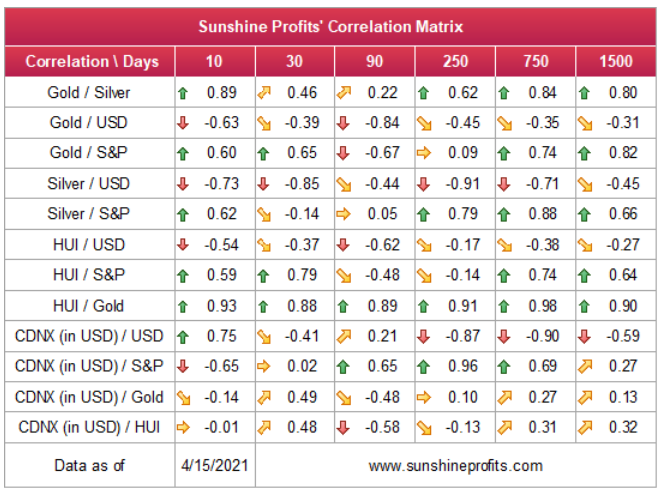
As a result, if the U.S. 10-Year Treasury yield and the USD Index engage in an all-out offensive, their military might could indicate the death knell for the precious metals. Case in point: if you analyze the table below, you can see that gold, silver, and mining stocks often move inversely to the U.S. dollar.
The bottom line?
Given the magnitude of the 2017-2018 upswing, ~94.5 is likely the USD Index’s first stop. And in the months to follow, the USDX will likely exceed 100 at some point over the medium or long term.
Keep in mind though: we’re not bullish on the greenback because of the U.S.’s absolute outperformance. It’s because the region is doing (and likely to do) better than the Eurozone and Japan, and it’s this relative outperformance that matters, not the strength of just one single country or monetary area. After all, the USD Index is a weighted average of currency exchange rates and the latter move on a relative basis.
In conclusion, the generals have mapped out their strategies, soldiers have manned the perimeter, and the loser of the upcoming battle will likely end up losing the war. However, with the precious metals being outmanned and outgunned, the USD Index will likely plant its victory flag, while gold, silver, and the mining stocks are forced to retreat and regroup. As a result, a major fallback is likely before the precious metals can resume their long-term uptrend. Due to the USD’s breakdown below the 50% retracement, they could decline in the very near term (while gold rallies a bit more – say to $1,800 or so), but don’t let that trick you into thinking that the next big move is going to the upside. In my view, that’s actually likely to be an important top that’s then going to be followed by an even more important decline in the precious metals and mining stocks. Then, after several weeks or months of declines, PMs can bottom and finally soar without huge declines on the horizon.
Disclaimer: All essays, research, and information found above represent analyses and opinions of Matthew Levy, CFA and Sunshine Profits' associates only. As such, it may prove wrong and be ...
more

