
Gold: The Least Bad Alternative
Back in March 2019, I wrote a post titled “A Golden Macro Opportunity” discussing the extreme compression in volatility we were seeing throughout the precious metals complex and how this portended an equally extreme expansion in vol and a major move on the horizon.
A little over a month later we saw gold break out giving rise to a new bull trend.
Since that was roughly a year ago and quite a bit has changed *understatement* I figured now is a good time to update my thoughts on the barbarous relic.
To kick things off, I’ll quickly summarize my fundamental lens for analyzing gold.
-
- The total size of the “investable gold” market is a pittance relative to the global capital stock (equity + debt). Think $1-2trn vs $250-300trn.
- Demand is what drives price in this equation, not supply.
- Since gold is not a productive asset it’s the expected real return of other financial assets (stocks and bonds) that drives its marginal demand.
- When the expected returns for stocks and bonds is high, gold does poorly. When they’re low, gold outperforms everything else.
Inflation/deflation and crisis insurance are, for whatever reason, the things most people talk about when looking at gold. But, when it comes to the yellow metal, it’s a matter of relativity. Gold is seen as a steady store of value in times when the expected returns for all other alternatives are low. And since the supply is tiny compared to the potential demand, it doesn’t take much of a change in investing preferences to significantly move the needle.
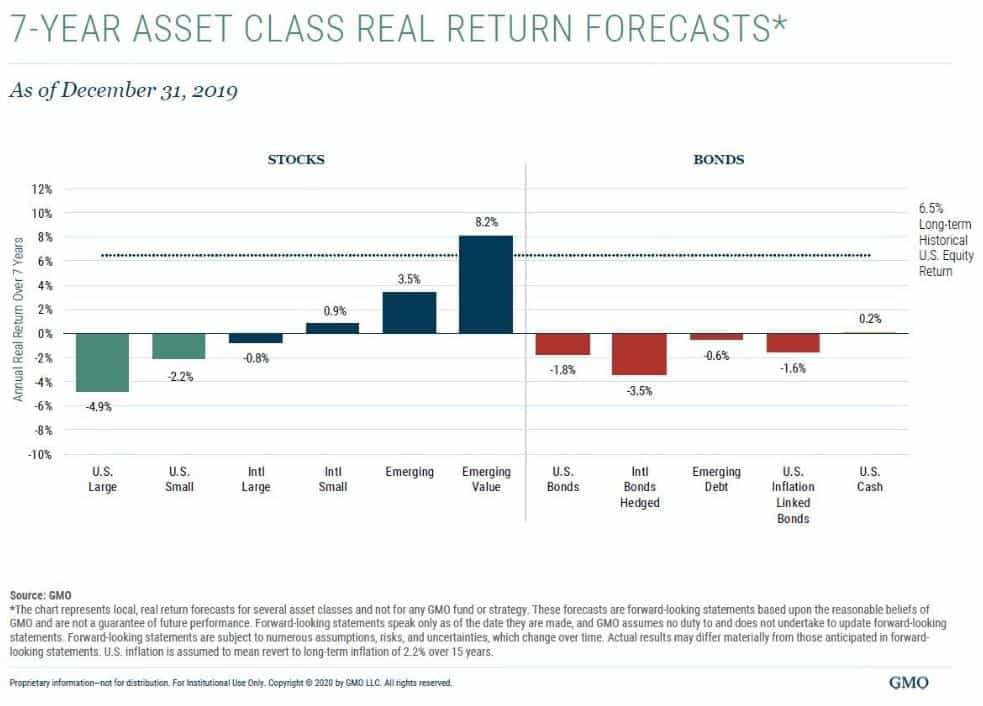
What are the expected returns for stock bonds then?
GMO’s 7-year forecast has US large caps averaging -4.9% real returns and US bonds at -1.8%.
The expected annual nominal returns for the S&P over the next decade is roughly 1.1%.
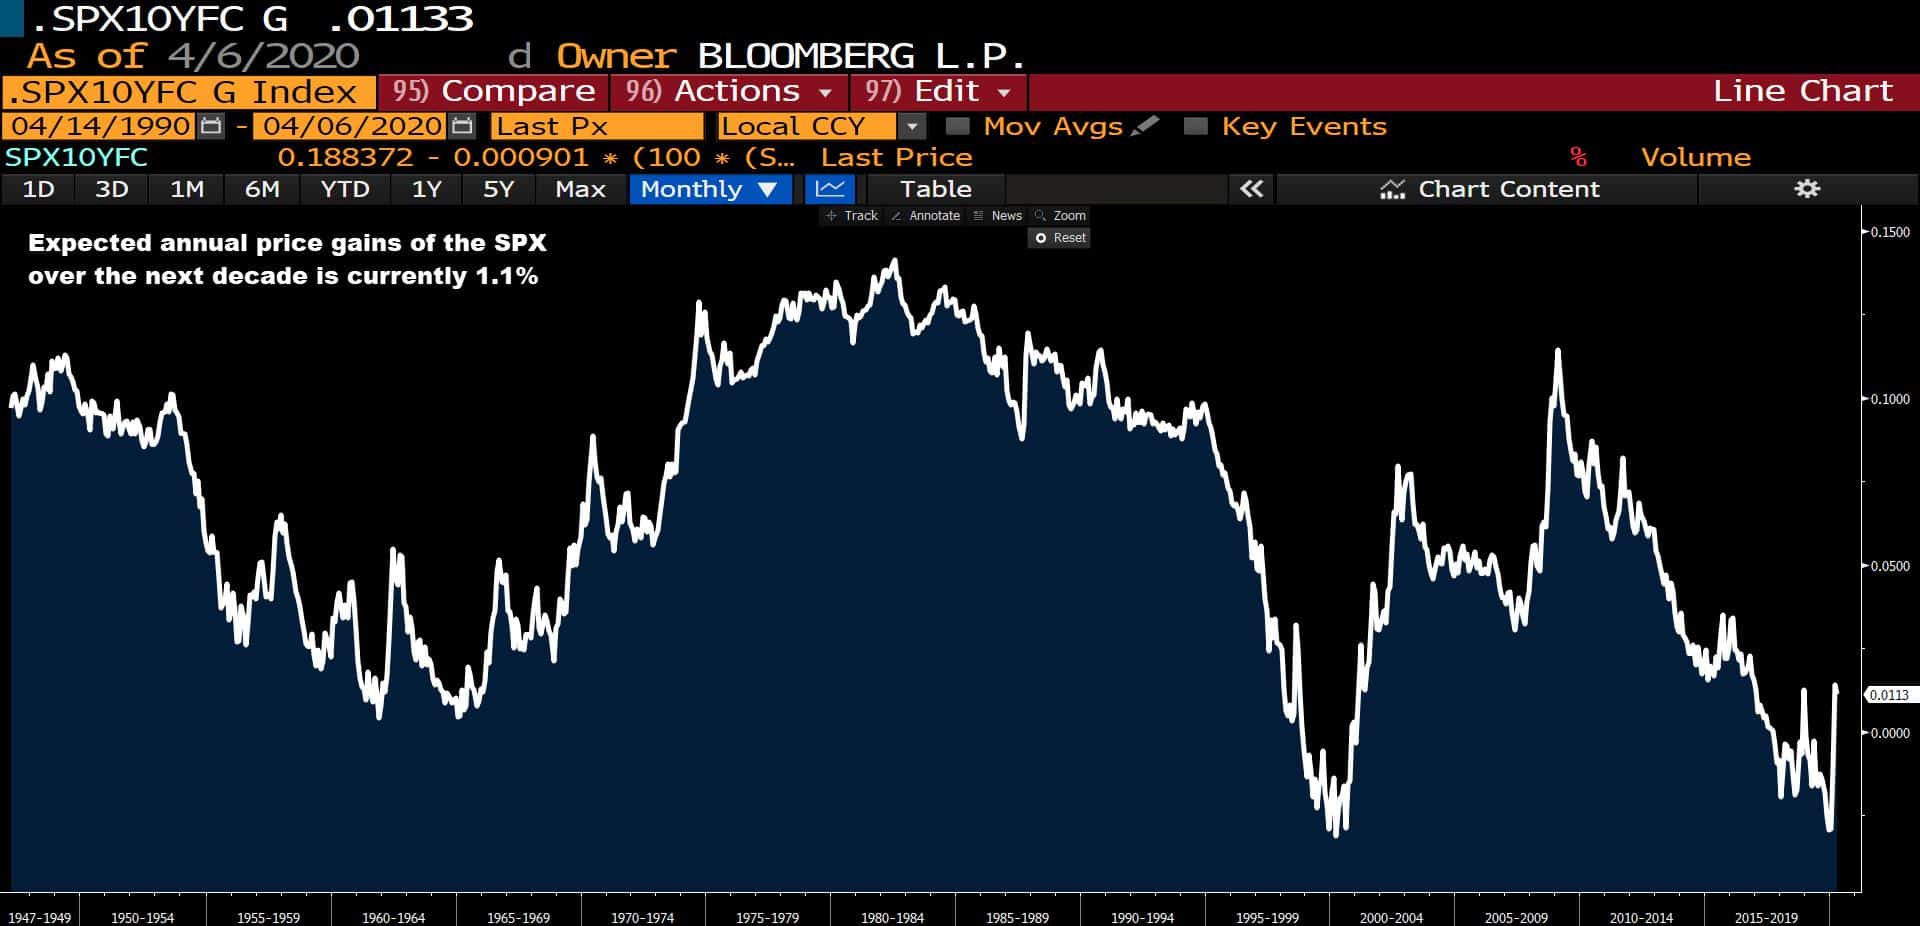
Needless to say, these expected returns leave one wanting.
Enter gold.
Gold has been in a technical uptrend for nearly a year now (chart below is a weekly). It’s currently working through a big supply overhang in the 1,600-1,800 zone. The move is being helped along by the fall in real yields which we can see in the bottom panel (lower real yields reflect lower future returns).
US 10-year yields are following in the footsteps of its peers who are a tad bit further along in their long-term debt cycles. Japan has led the way and I fully expect we’ll see zero rates across most of the curve and some form of yield curve control before this is all said and done — our mountains of debt all but ensure it.

This, of course, makes gold that much more of an attractive asset.
The short-term technical chart is shaping up well, suggesting another leg may be getting underway. It just completed a continuation inverse H&S pattern and closed above the 1,700 level which had been acting as resistance.
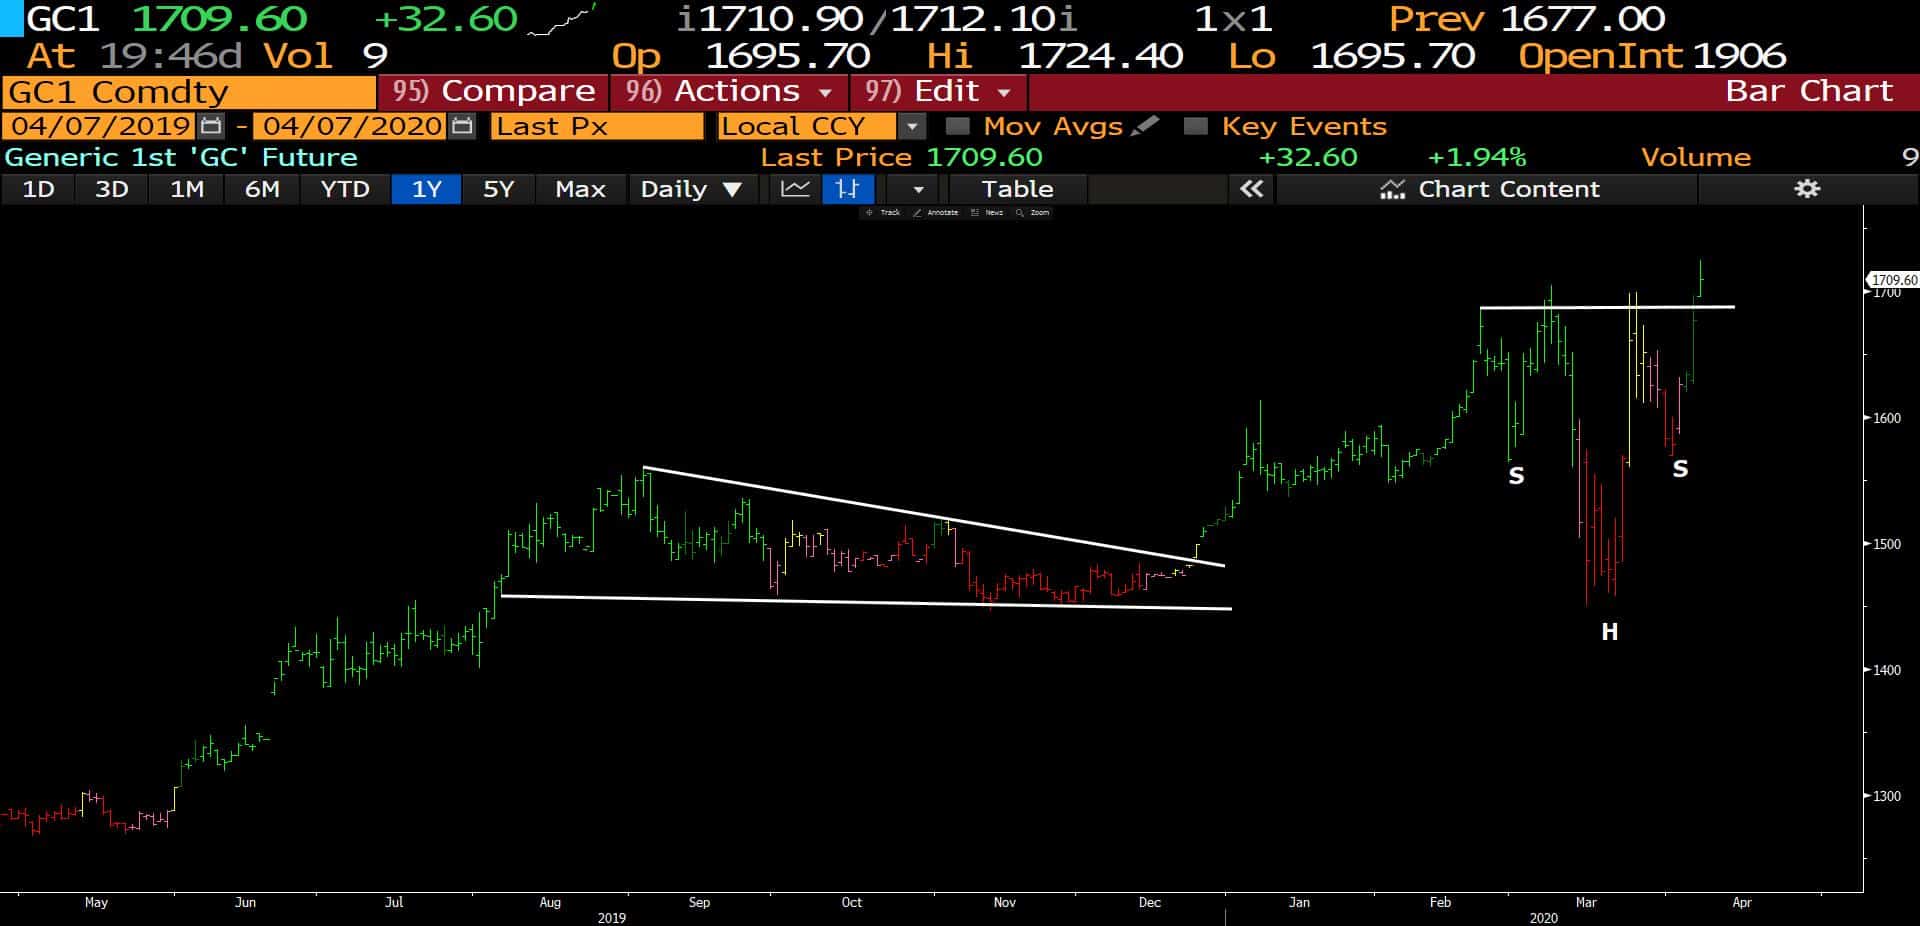
I expect gold will take out its all-time high made in 2012 within the next six months. After that, the sky is the limit.
I have a high conviction on this trade over the long-term. However, over the short-term anything is possible if the market were to go into full-on liquidation mode again. I’d step back on the sidelines should the price dip below the right shoulder near the 1,550 level.
Disclaimer: All statements are solely opinions and are for educational purposes only.


