
Gold Prices Rise On Falling U.S. Treasury Yields And Geopolitical Risk Ahead Of FOMC

XAU/USD FUNDAMENTAL BACKDROP
Spot gold has been on the climbing this week after markets continue with the view that a hawkish Fed is priced in leaving the U.S. dollar disappointing from earlier expectations. Investors have been looking elsewhere for opportunities that have kept the dollar muted despite U.S. 10-year Treasury yields hitting levels last seen in early 2020. The outlook remains bullish for the greenback but the post-FOMC conference next week should shed more light on the balance sheet run-off approach.
U.S. 10-YEAR TREASURY YIELD
(Click on image to enlarge)
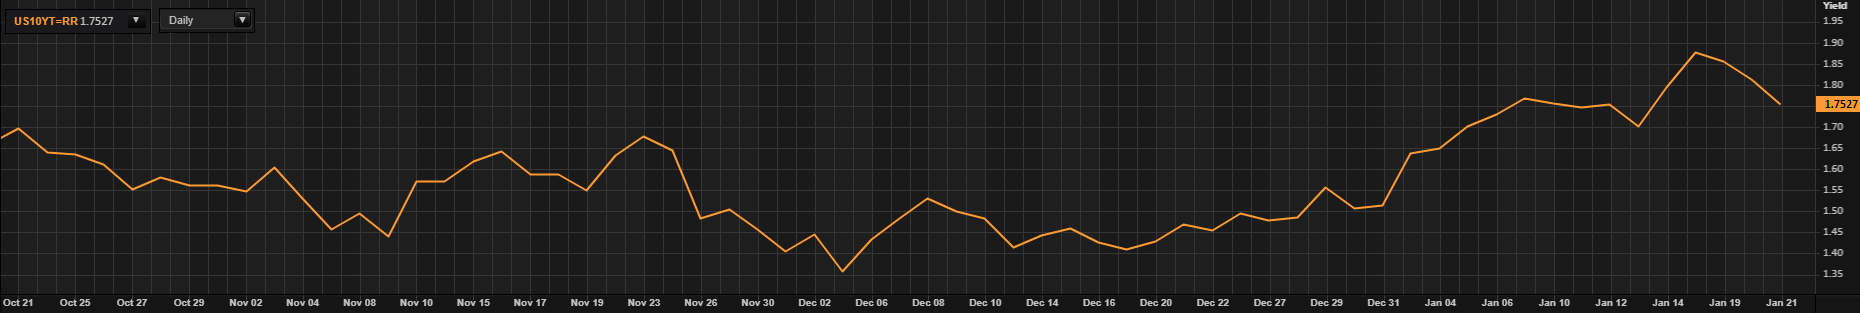
Source: Refinitiv
Short-term, Russia-Ukraine pressures could have a significant impact on the commodity market should sanctions be imposed on Russia driving higher natural gas and wheat prices in particular. Global inflation is already running hot with China’s zero-tolerance approach to COVID-19 and rising oil prices adding fuel to the fire. An extra layer of infliction from Russia/Ukraine would give gold a positive outlook via its tenuous “inflation-hedge” designation.
A more longer-term view (yearly forecast) favors a decline in gold prices with higher interest rates, rising real yields, fading inflation, and a stronger U.S. dollar.
TECHNICAL ANALYSIS
GOLD PRICE DAILY CHART
(Click on image to enlarge)
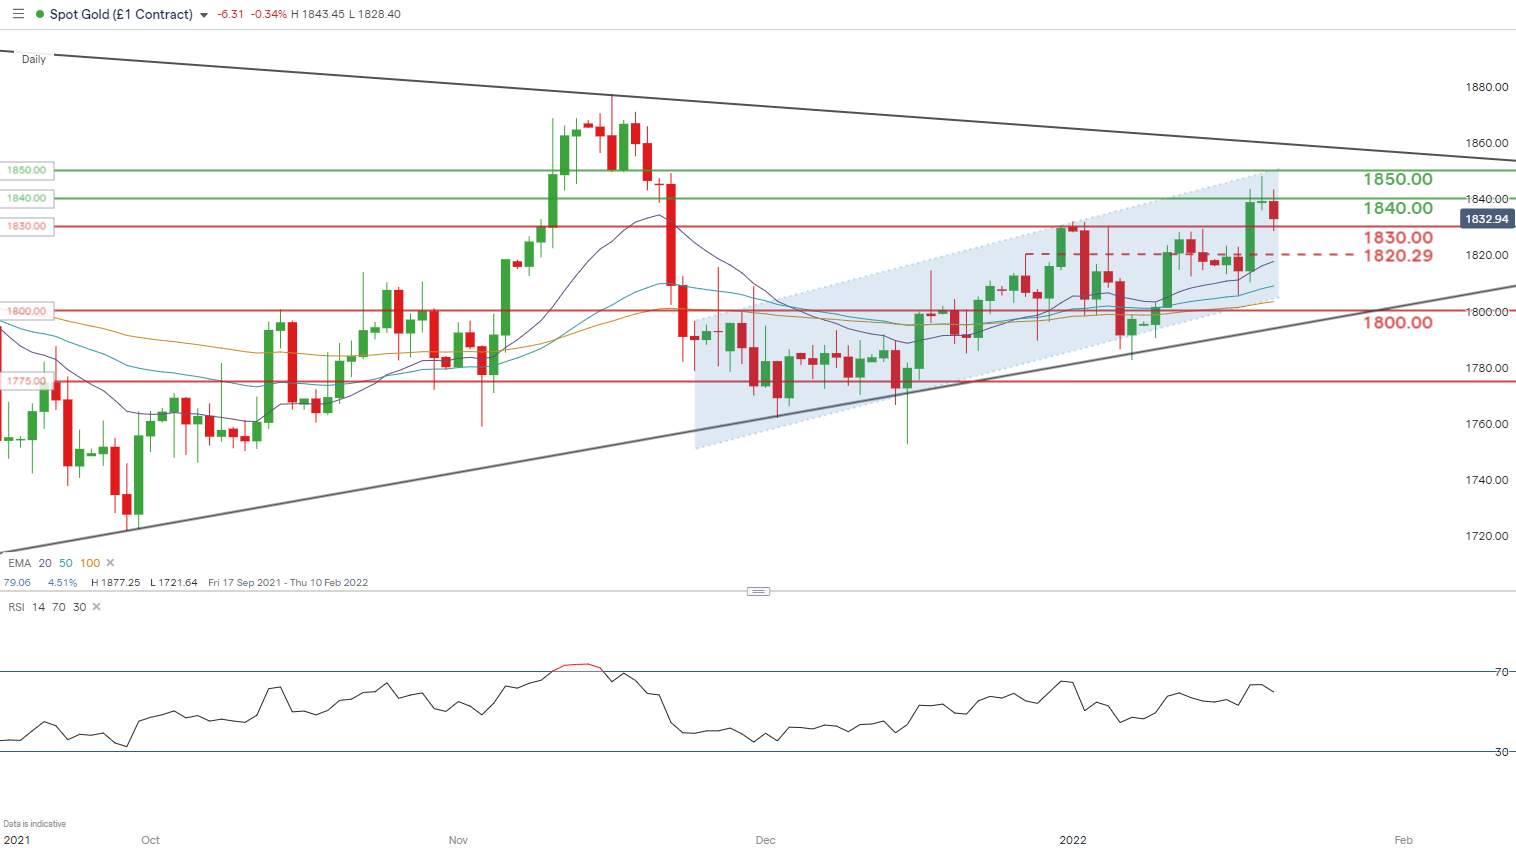
Chart prepared by Warren Venketas, IG
The medium-term symmetrical triangle constricting gold price action since mid-2021 is converging pointing to an impending breakout. The eventual break above 1830.00 earlier this week saw prices reach almost 1850.00 before settling around 1840.00.
A rising channel structure (blue) is also evident since late 2021 which resembles a bear flag pattern. A bear flag is traditionally indicative of a bearish continuation should prices break below flag support. With fundamentals supporting a weaker dollar long-term, this is definitely a pattern to keep an eye on.
From a bullish standpoint, there is still room to run up to triangle resistance (black) and may coincide with an overbought Relative Strength Index (RSI). Fundamentals are heavily influential at this current juncture but directional bias should be evident post-FOMC.
Resistance levels:
- 1850.00
- 1840.00
Support levels:
- 1830.00
- 1820.29
IG CLIENT SENTIMENT BEARISH
IGCS shows retail traders are currently distinctly long on gold, with 70% of traders currently holding long positions (as of this writing). At DailyFX we typically take a contrarian view to crowd sentiment and the fact traders are net-long is suggestive of a short-term bearish inclination.
Disclaimer: See the full disclosure for DailyFX here.


