
Gold Prices Fall As Yields Rise, S&P 500, Nasdaq 100 Pull Back After NFP
This morning brought a strong headline number for the May NFP report. While the headline number put in a strong beat (390k v/s 325k expected), the unemployment rate remained at 3.6% which was just above the 3.5% expectation. Perhaps more importantly, the inflation component of the report showed a month-on-month gain of .3% v/s the .4% expected, and that’s in line with last month’s .3% print.
The initial result was a quick pop of USD strength which has mostly faded about an hour after the release. And in a related move, Treasury yields bumped higher with the 10-year coming close to another test at the 3% marker before similarly pulling back. And it’s that theme in yields that’s had a pull on a number of other markets of late, equities included.
The 10-year note set a fresh three-year-high at 3.167% on May 9th, as a big spot of longer-term resistance came into play.
10 Year Treasury Note Monthly Chart
(Click on image to enlarge)
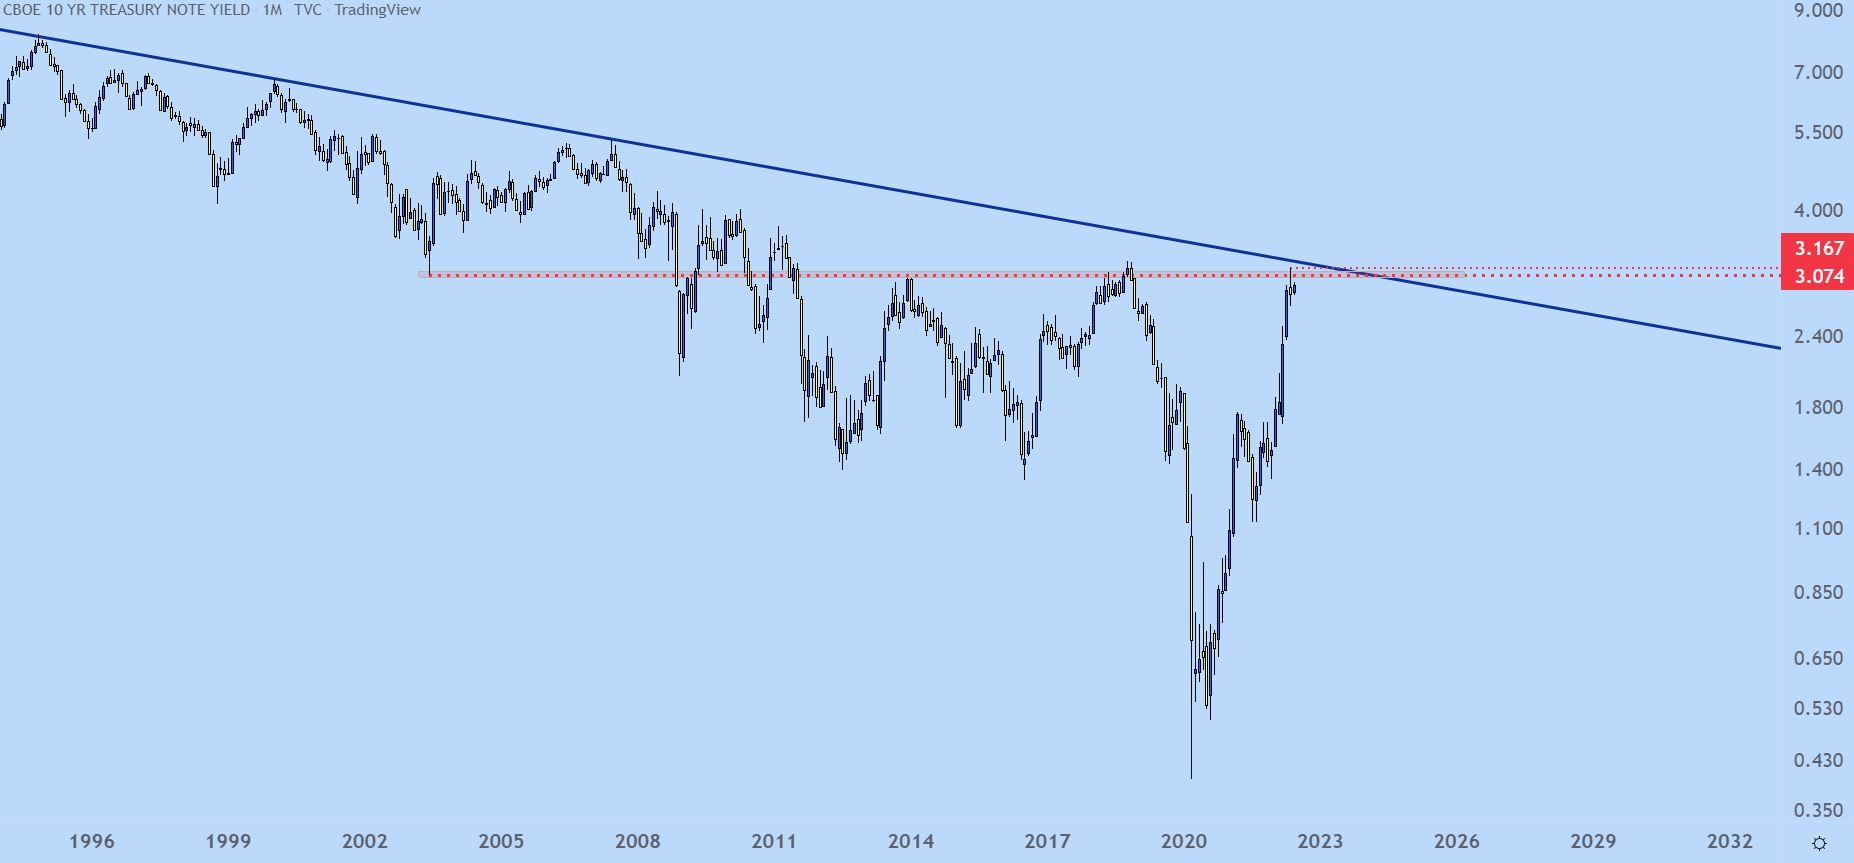
Chart prepared by James Stanley; TNX on Tradingview
After that fresh high on May 9th, yields pulled back for the next two-plus weeks, falling back down to a low of 2.708% that was hit twice, on May 25th and May 27th. That’s a -14.46% move in two weeks in one of the most important asset classes in the world; a strong show of volatility that highlights some of the tension that’s under the surface.
10 Year Treasury Yield – Daily Chart
(Click on image to enlarge)
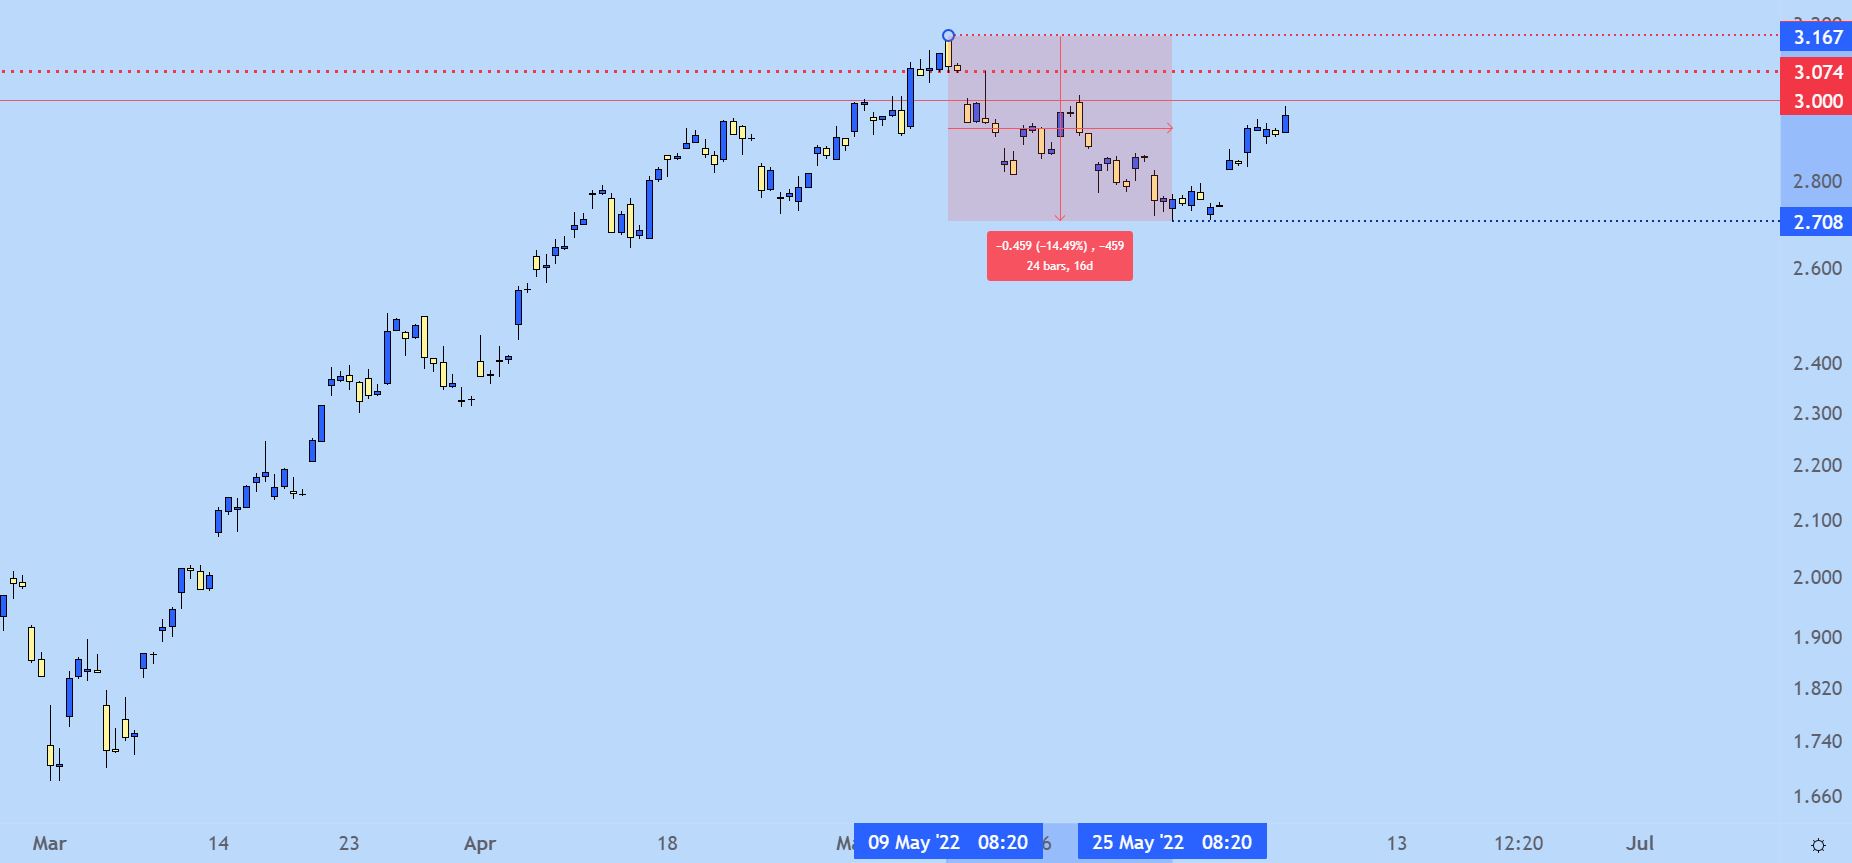
Chart prepared by James Stanley; TNX on Tradingview
This morning saw yields on the 10-year push back up towards the 3% marker, which is an important psychological level. And as yields have been rising this week, helped along by a number of Fed speakers talking up the prospect of even more rate hikes, pressure has started to reappear in stocks.
As I wrote last night, there remain a number of bearish factors stacking up for stocks. And this week wasn’t encouraging on the matter as there’ve been some pointed comments from some noteworthy individuals opining on the matter. Jamie Dimon said this week that he saw an ‘economic hurricane’ on the horizon. This is the leader of one of the most important banks in the world and this is not a man known for hyperbole. But, perhaps more telling, if the head of one of the largest banks in the world is preparing for storm clouds ahead, much less a hurricane, that means a reigning-in of spending, which further exacerbates the slowing of capital in the economy.
And then last night, Elon Musk fired off another email to his employees, saying he has a ‘super bad feeling’ about the economy and would need to lay off 10% of his workforce.
Collectively, this has started to stack up to more and more pressure on equities. The resistance zone on the S&P 500 looked at yesterday has held a second inflection, and prices are now tilting below short-term support at 4147. The next spot of support on my chart is around the 4100 level, with 4062 below that followed by a major spot at the 4,000 psychological level.
S&P 500 Two-hour Price Chart
(Click on image to enlarge)
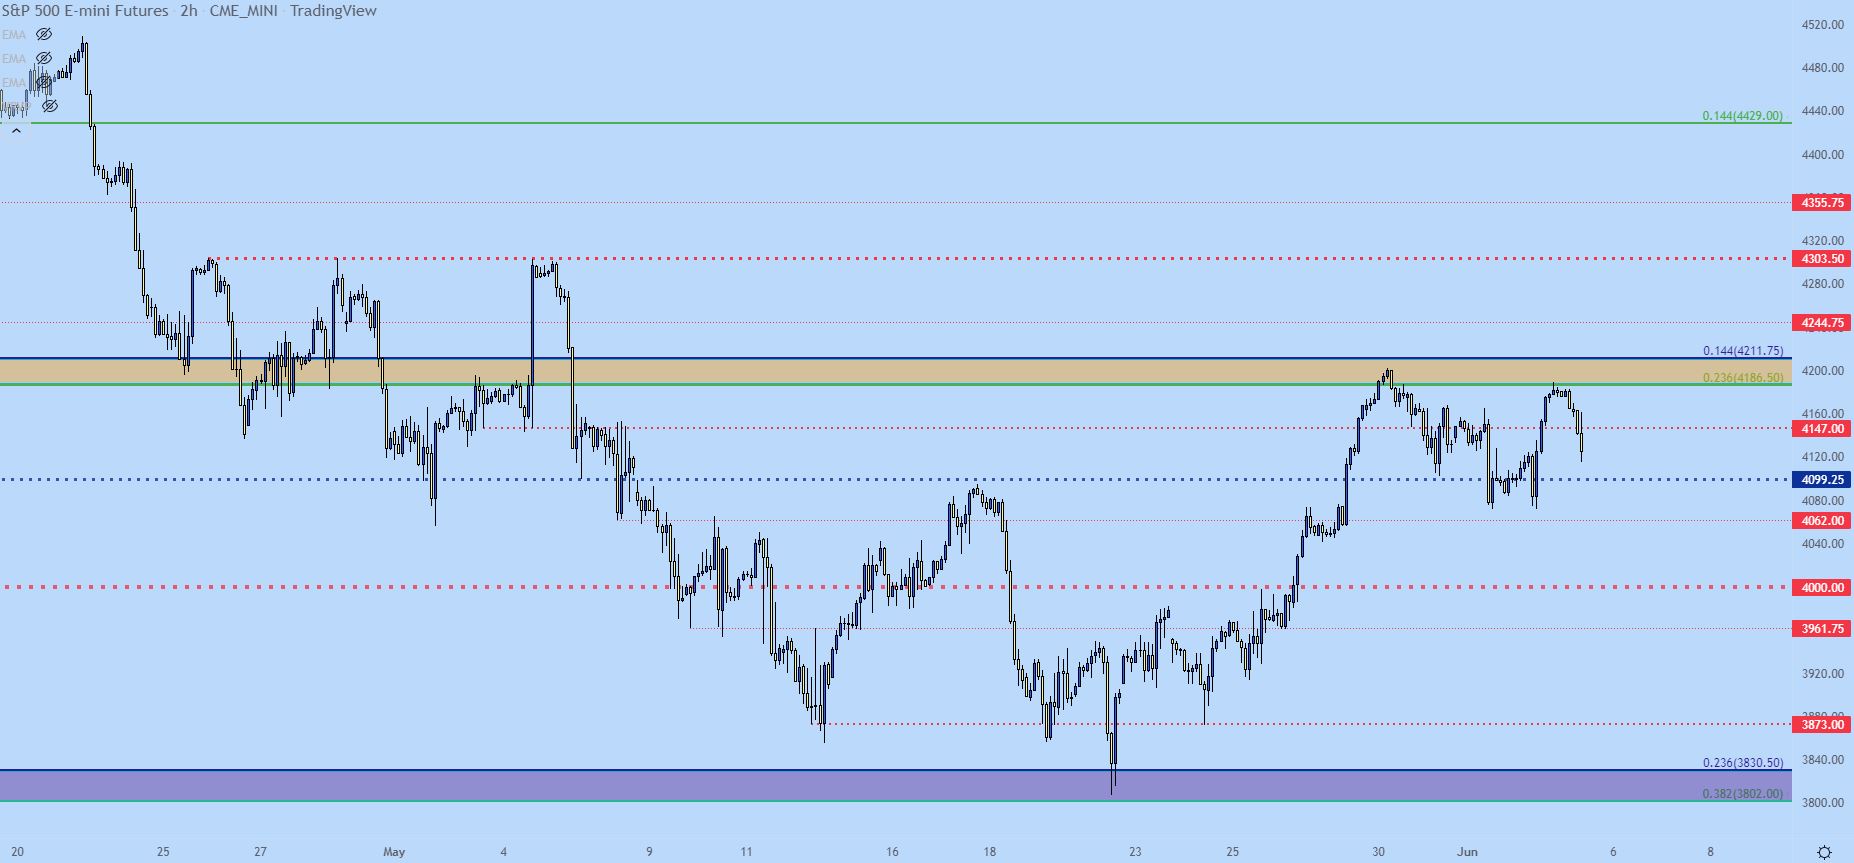
Chart prepared by James Stanley; S&P 500 on Tradingview
The Nasdaq 100 was in a similar spot, re-testing a key zone of resistance that had displayed some previous support. The difference here, however, is slight but important. While the S&P 500 held below that prior swing-high, the Nasdaq 100 actually budged above that prior higher, which can keep the door open for some short-term bullish potential, particularly if buyers can defend support above the 12,465 level that was in play earlier this week on all of Tuesday, Wednesday and Thursday.
If/when that zone gives, the breach could be sizable but, so far, it’s held three inflections. If buyers are able to pose a bump up to a fresh high, there’s deeper resistance at the 13,000 psychological level and that could be of interest for fade plays.
Nasdaq 100 Two-hour Price Chart
(Click on image to enlarge)
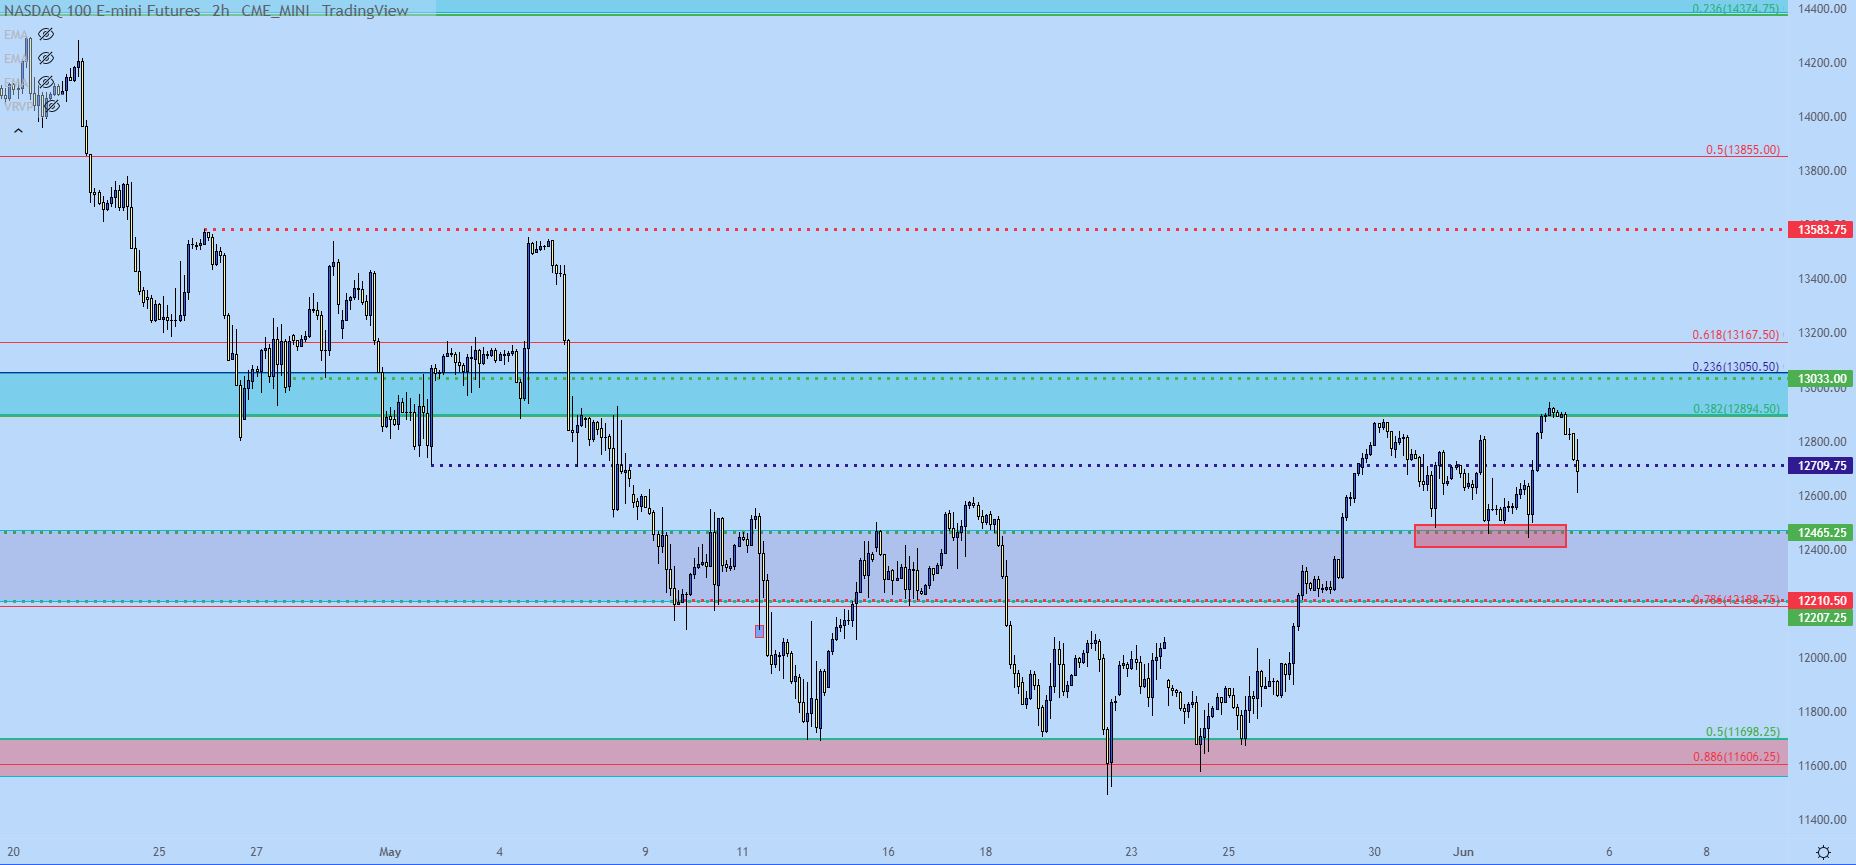
Chart prepared by James Stanley; Nasdaq 100 on Tradingview
Gold Resistance
Gold put in an initial bearish move on the NFP print but such as we’re seeing with the US Dollar, that move has already been mostly faded-out. So, at this point, the focus moves to next week and the bigger picture setup.
As yields started pulling back last month, buyers returned to Gold. And prices put in a very respectable run of more than $100 from the May low up to the recent June high. But, that June high printed at a key spot of resistance, taken from the 50% marker derived from the Fibonacci retracement spanning the move from last August’s low up to the March high. That level plots at 1878.40 and it came into play overnight, leading to a move back below 1860 on the heels of NFP.
I remain bearish here, but the near-term trend of strength needs to show greater potential for reversal before that short-side theme becomes attractive again. The next key spot of resistance on my chart is in the zone spanning from 1888 to 1891, and above that is a major long-term zone that runs from 1900-to 1920. I would want to see buyers push above 1925 before abandoning the bearish bias.
Gold Four-hour Price Chart
(Click on image to enlarge)
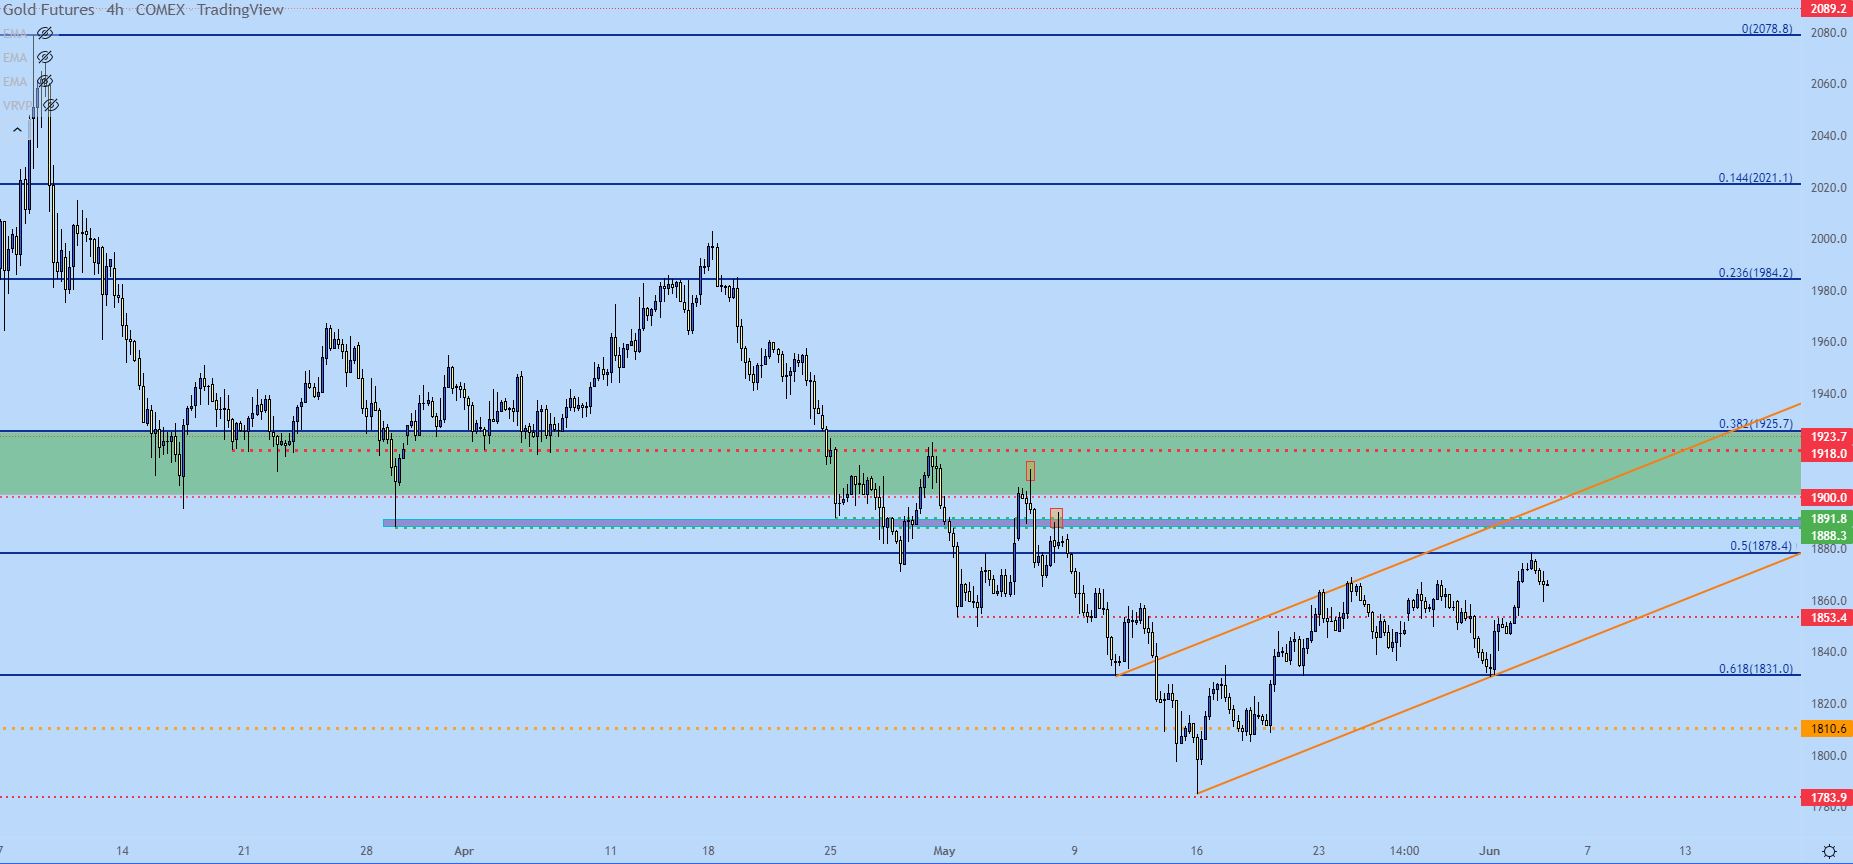
Chart prepared by James Stanley; Gold on Tradingview
Disclosure: See the full disclosure for DailyFX here.


