
Gold Bottom
Enthusiastic gold investors everywhere are wondering…has gold finally bottomed?
The short answer is… I think so.
That’s because, from a number of perspectives, that seems the most likely scenario. Right now most of the evidence points in that direction.
A dramatic rip higher from March to August last year caused gold to soar by 40% in just 5 months. It also allowed gold to establish a new nominal all-time record high at $2,070.
Since then gold’s been retracing, giving up about half of those gains. Two major drivers led to this: sentiment and the dollar. At this point, however, it seems both factors may have run their course, setting up gold and gold stocks for a new rally.
Let’s examine the current outlook to formulate what’s most likely ahead.
Negative Gold Sentiment Exhausted
Markets ebb and flow, and gold is certainly no exception. The dramatic rise last spring and summer was likely driven by fear as the impact of the COVID-19 pandemic was being assessed.
One of gold’s biggest attractions is obviously as a safe haven, a role it’s played for thousands of years. And last year was an excellent example. But as the world grew accustomed to its new reality, that meant other drivers took center stage.
It was also natural for gold to start ebbing. Naturally, large numbers of investors became enamored with gold and gold stocks as they chased them higher. That meant lots of buying near the early August peak. But that buying soon became exhausted.
Savvier investors then started to take profits while the late buyers eventually capitulated after buying high. Their lack of understanding, and lack of conviction, made them victims. It looks like that final capitulation happened in late March, as the sentiment pendulum swung to an extreme.
But fundamental drivers worked in conjunction with sentiment to help mark a turning point.
I have detailed before the effect of rising long-term bond yields. Consider that the US 10-year Treasury yield bottomed at 0.51%, just two days before gold peaked. Since then the 10-year yield has soared, peaking on March 31 at 1.75%. That’s a 240% spike in yields. Massive global fiscal and monetary stimulus on a record scale caused investors to start pricing in much higher expected inflation.

This hurt gold prices in two ways. Higher yields compete with gold, which pays no yield. It also meant a higher US dollar index, as foreigners likely converted to dollars to buy those long-term bonds. Of course, a stronger dollar is a natural headwind for gold which is priced in dollars.

But as we can see in both previous charts, this upleg appears to have run its course. Prices have retreated, and momentum indicators suggest a recent peak.
And the action in gold prices is starting to look bullish for the first time in months.
Gold’s Technical Outlook is Positive
Technical action in the gold price is beginning to look bullish. We may have a double bottom, wherein the recent low established a bullish higher low. And both the RSI and MACD momentum indicators are rising, confirming the rising trend.

The action in gold-stock prices is similar. Using the VanEck Vectors Gold Miners ETF (NYSE: GDX) as a proxy, we see several bullish signals. GDX has recently closed above its 50-day moving average and broke out above its falling trend channel. It too has established a higher low with rising buying volume. And both the RSI and MACD here are confirming upward momentum.
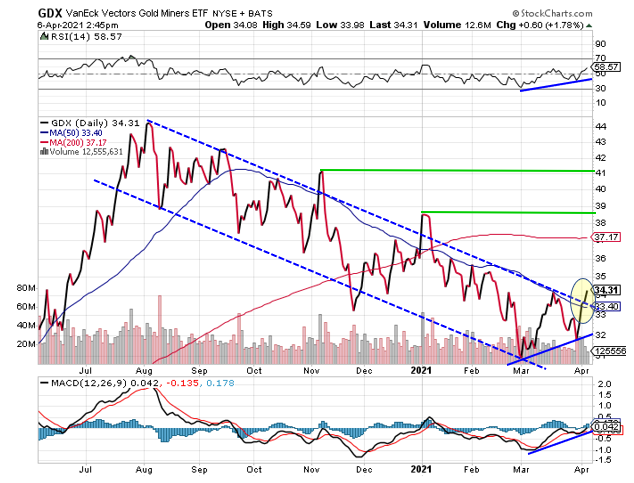
My upside price targets for GDX are $38.50 and $41.
And lastly, the Gold Miners Bullish Percent Index (BPGDM) is also providing a bullish signal. This indicator is most bullish when it dips below 30 then reverses higher. And in the last week, that’s exactly the signal it provided.

So given a likely reversal in sentiment, combined with positive price action in gold, gold miners, and their momentum indicators, odds are very good that we’ve seen the bottom for gold and we’re starting a new upleg in this sector.
Oh and one more thing. Gold stocks are cheap. The average stock in GDX trades at a P/E of just 20 and at less than 10 times cash flow. By comparison, the S&P 500 index currently trades at a P/E of 28 and over 16 times cash flow.
And according to U.S. Global Investors, gold producers had their most profitable year ever in 2020. The average profit per ounce mined was $828, which is well above the previous high in 2011 at $666. Part of this record profit level has been due to cost discipline.

Put it all together, and the indicators – sentiment, technical and fundamental – all point to higher gold and gold stocks over the near and medium-term.
Of course, it’s impossible to know for certain that gold has bottomed. But given the outlook for this sector, as I’ve just laid out, it makes sense to layer into gold positions over the next several weeks.
In all likeliness, those who do will be amply rewarded.
After all, it’s a gold bull market !


