
Gold: Bearish Sentiment Makes A Bottom In Precious Metals
For the past seven months, gold and silver have been in the news based on a short squeeze and shortages. However, they went the other way and we have seen a Fibonacci correction in gold. The fundamentals do not seem to matter. Gold and silver are experiencing shortages. The physical prices are running far above the paper market prices, so we have a discrepancy between the physical and paper markets. The futures markets are more volatile because they do lead pricing for the cash market - at least traditionally. At some point, the paper markets will reflect the cash markets. But at this point, the precious metals are technical markets.
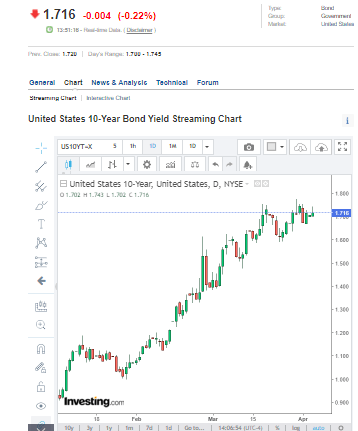
The government is pumping money into the system. The 10-year note reached 1.77, which indicates that fears of inflation are beginning to affect the market. The grains are also moving up rapidly, which will lead to higher food prices in the near future. These rises make the bond and credit market nervous. Everyone is talking about higher rates, which does not bode well for the US dollar, yet the stock market is making new highs in the face of possibly higher interest rates. A lot of things do not make sense. If interest rates are at risk of increasing, it is not bullish for stocks, yet stocks continue to make new highs. The rise in interest rates may be of short-term duration and we may soon go back down to lower interest rates or even negative rates. It is a possibility. Interest rates almost doubled from early this year/late December 2020, probably so the Fed could bring them down once again. The amount of money coming into the market from the government is unprecedented. Now the government is talking about pumping another $4 trillion into the markets. We are looking at an increasing percentage of GDP in terms of stimulus. It is a trading opportunity because we see a lot of volatility coming back into the market, especially in gold and silver.
The Markets
The markets are quiet this morning. Gold is turning positive at $1728.90 and silver is positive at $24.96. Copper is up 12 cents. Copper is picking up a lot of interest right now. There is anticipation about a shortage in silver and gold, so copper, platinum, and palladium are getting some interest. The derivatives, JNUG, are on the plus side this morning. We are getting a good indication that the aggregates are turning bullish in the gold market.
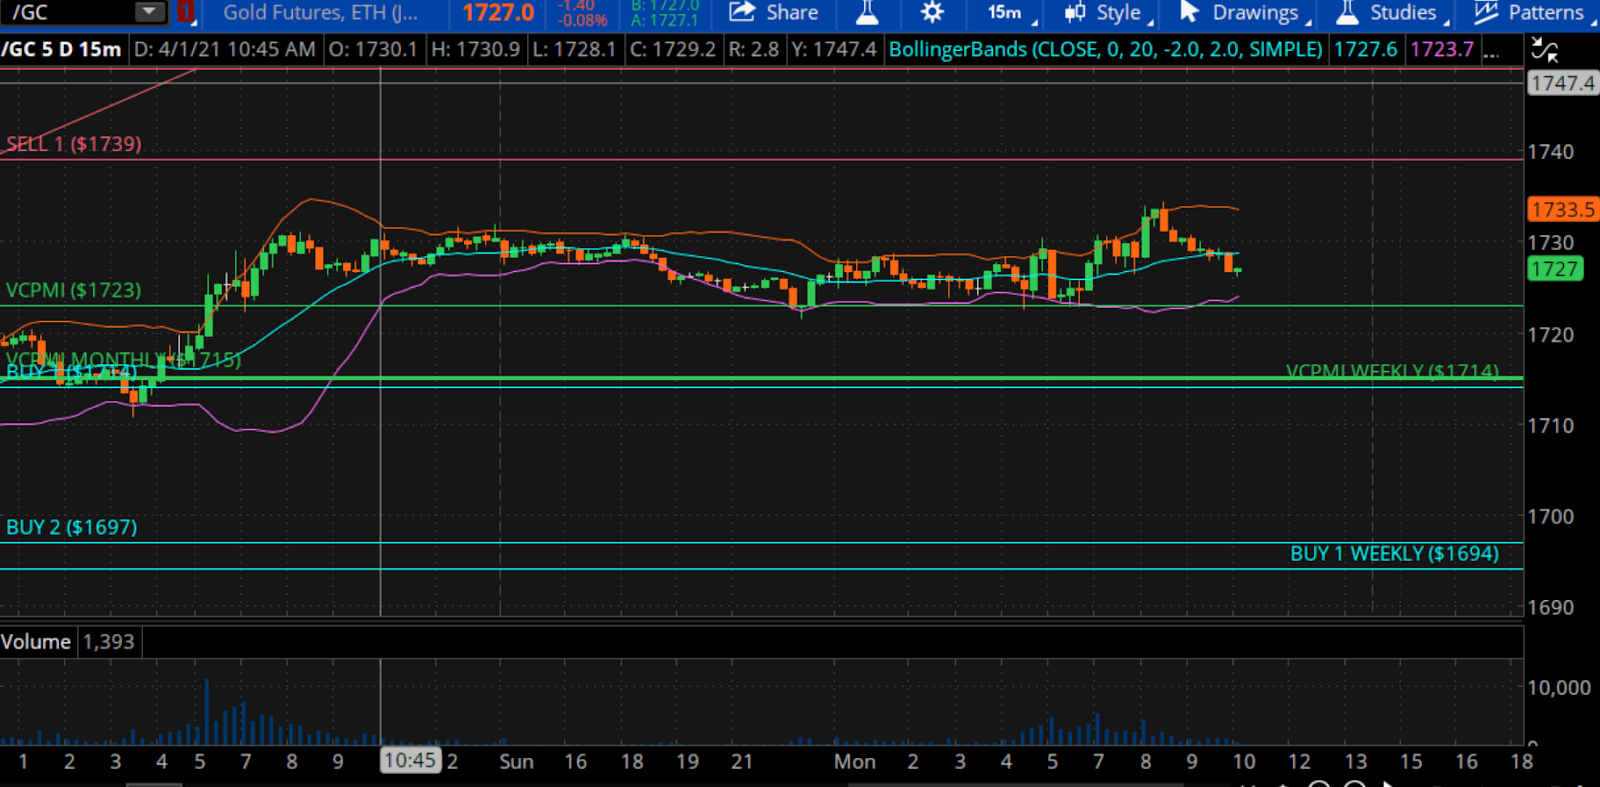
Courtesy: TD Ameritrade
By trading above the Variable Changing Price Momentum Indicator (VC PMI) average price of $1722.90, gold is in bullish trend momentum. As long as it holds above $1722.90, the target is the Sell 1 level of $1739. Silver is also trading above the VC PMI average of $24.78, which is bullish with a target of $25.30. Copper is at $4.10, which has completed the upside targets. The high is $4.1275. $4.0675 was the suggested VC PMI daily target. It is up 12 cents. Friday we recommended buying copper and we are taking profits. We are looking at day and swing trading opportunities.
We continue to carry a core long position in gold and silver. We short the market for day trading but maintain our long position.
In gold, we are seeing a harmonic alignment between the VC PMI daily at $1714 and the monthly average at $1715. With the market trading above the average VC PMI monthly price, it activates the monthly targets Sell 1 of $1754. Either the market will find enough buyers to go all the way up to $1754 or it will revert back down to the buy levels. Anything above $1739 to $1754 has been identified as a very strong area of supply or sellers coming into the market. That area marks where reversions are likely to occur. Above that level is the 50% Fibonacci retracement from the low last year in March to the high of $2089. The target is $1799, which is the monthly target for the VC PMI. There are a slew of indicators around $1754 up to $1772 (the weekly target), which suggests that area is critical for supply to come into the market. A close above $1772 would validate the daily, weekly, and monthly VC PMI signals, as well as the Fibonacci 50% retracement. It would complete the pattern. It is a pretty bullish indication for gold, but there is a wall of resistance to conquer. If we close above $1772, then we will probably be off to the races up to $1931- the 23.6% Fibonacci retracement level.
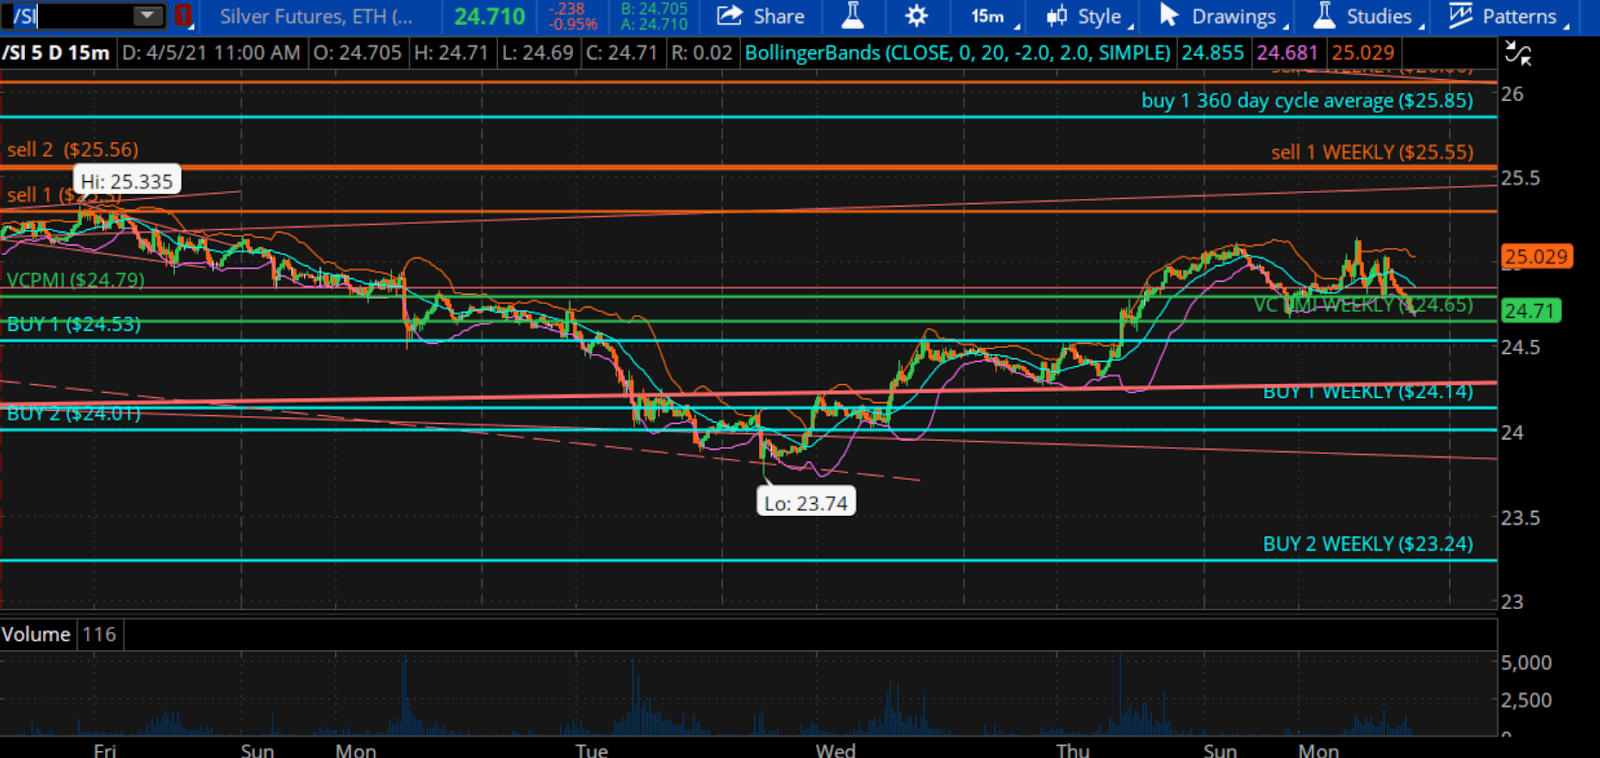
Courtesy: TD Ameritrade
Silver came down to an area of support and then reverted back up. We found weekly pockets of support between $24.14 and $23.24 before reverting back up. The Sell 1 level of $25.28 and Sell 2 level of $25.56 were activated. The Sell 2 level matches the weekly Sell level, so we are seeing a harmonic alignment. It is a magnet that will attract the price to complete the pattern. $25.30 is a good target as far as the daily momentum is concerned.
The VC PMI
The VC PMI is a momentum indicator, which identifies the supply and demand of a given market. You can use it as a GPS for your trading to let you know when to enter and exit the market. It provides two levels above the mean (Sell 1 and 2) and two levels below the mean (Buy 1 and 2) based on daily, weekly, monthly or annual data. The Buy 1 and Sell 1 levels have a 90% chance that the market will revert from those levels back to the mean, while the Buy 2 and Sell 2 levels have a 95% chance that the market will revert back to the mean. It is a probability model not a guarantee.
Disclosure: I am/we are long GDX. I wrote this article myself, and it expresses my own opinions. I am not receiving compensation for it (other than from SA). I have no business relationship ...
more

