
Gold And Silver Slammed Lower As The US Dollar Flexes Its Muscles
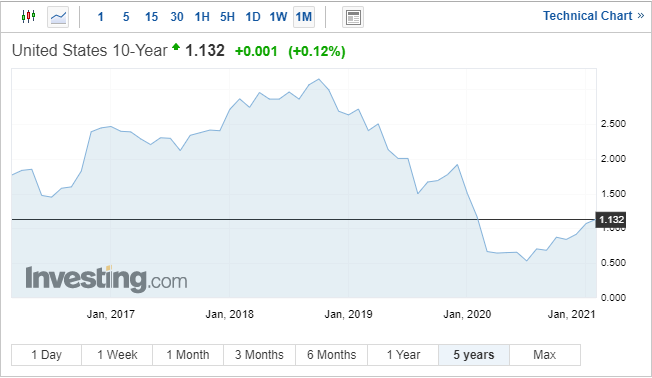
The price of gold continues to move lower and is set to test its recent nadir around $1,806/oz. The precious metal has been hit recently by a better risk-on tone and by a steeper US Treasury yield curve, a signal that economic expansion and a pick-up in inflation is expected further down the line. The closely watched UST2-10 curve is now over 100 basis points, a level not seen in nearly four years. This pick-up in yields is also underpinning the US dollar, which looks to have made a short-term bottom.
For all market-moving data releases and events see the DailyFX Calendar.
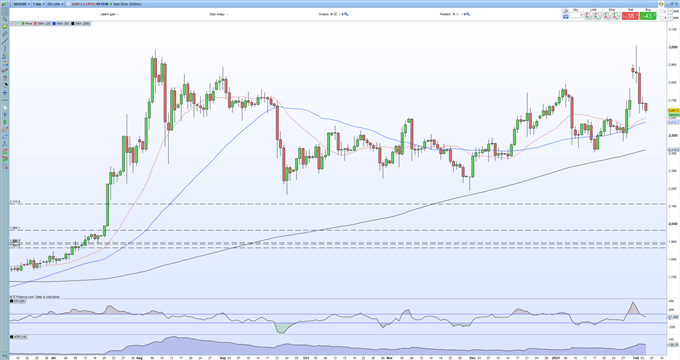
The daily gold chart shows the precious metal moving towards the mid-January low around $1,806/oz. with little in way of support after that before the late-November horizontal low at $1,764/oz. This week’s break lower has pushed gold below all three simple moving-averages, a negative signal, and with the US dollar on the rise, and with covid-19 vaccination programs picking up, gold may continue to press lower. It is important to note however that tomorrow sees the latest US Labor Report (NFPs) released, a known and sometimes unpredictable mover of the US dollar, so caution may be warranted ahead of the release.
Gold Daily Price Chart (June 2020 – February 4, 2021)

IG retail trader data show 85.80% of traders are net-long with the ratio of traders long to short at 6.04 to 1. We typically take a contrarian view to crowd sentiment, and the fact traders are net-long suggests Gold prices may continue to fall.
Positioning is less net-long than yesterday but more net-long from last week. The combination of current sentiment and recent changes gives us a further mixed Gold trading bias.
Silver is also under pressure and is off its recent spike high made after the reddit retail crowd named the semi-precious metal as its next target. Unlike other Wall Street Bet names like GME and AMC, there was never any real follow-through in silver which has given back most of the move. Unlike gold, silver is currently being supported by all three simple moving-averages, and while this remains the case, silver may continue to hold current levels.
Silver Daily Price Chart (June 2020 – February 4, 2021)
Disclosure: See the full disclosure for DailyFX here.


