
Financial Market Signals
The five-year inflation breakeven shrinks, the ten-year – three-month spread dives, and TIPS and expected real rates rise above zero. The S&P 500 and Bitcoin fall even as the VIX remains at sub-Trump levels.
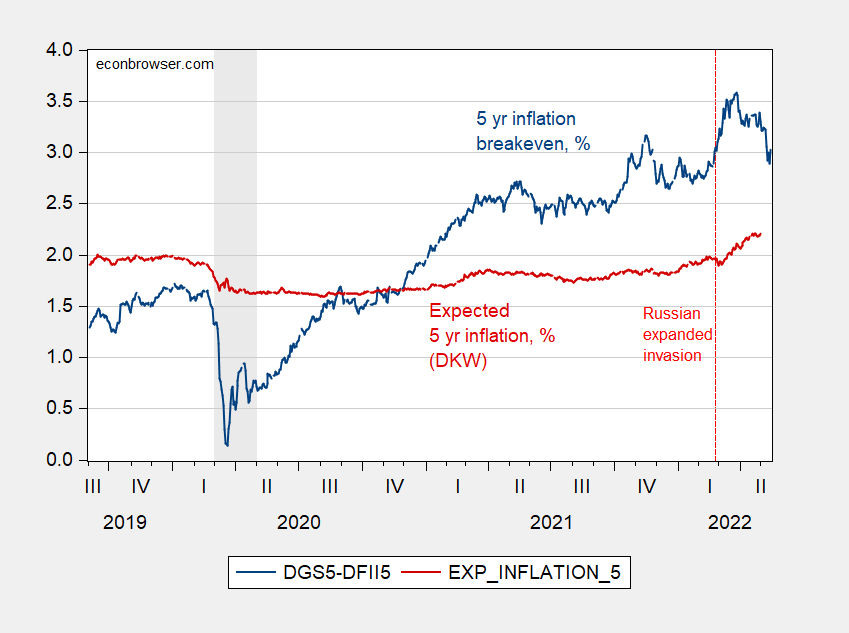
Figure 1: Five year inflation breakeven, 5 year Treasury minus 5 year TIPS (blue, left scale), 5 year breakeven adjusted for both inflation risk and liquidity premia, per DKW (red), both in %. NBER defined recession dates shaded gray. Source: Treasury via FRED, KWW per DKW, NBER, and author’s calculations.
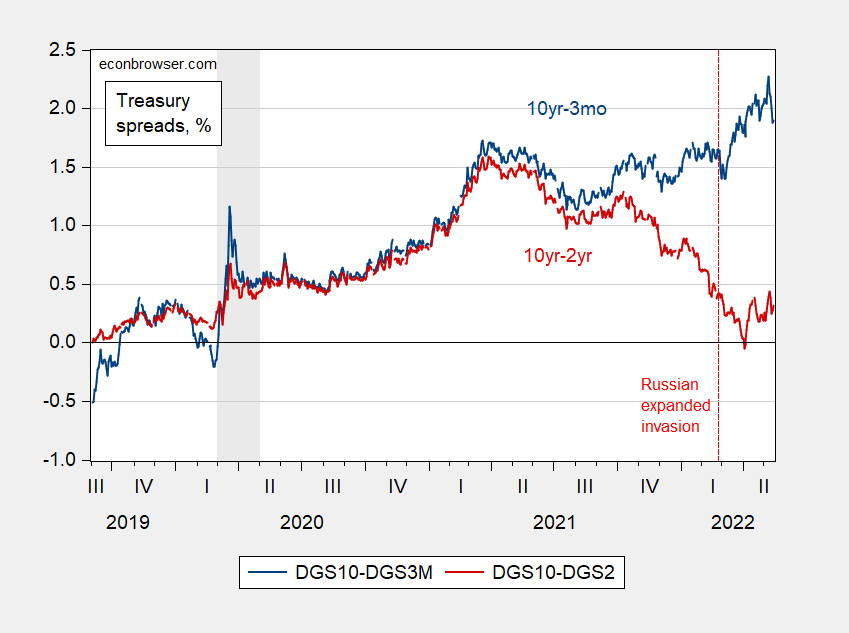
Figure 2: Ten year – three month Treasury spread (blue), ten year – two year spread (red), both in %. NBER defined recession dates shaded gray. Source: Treasury via FRED, NBER, and author’s calculations.
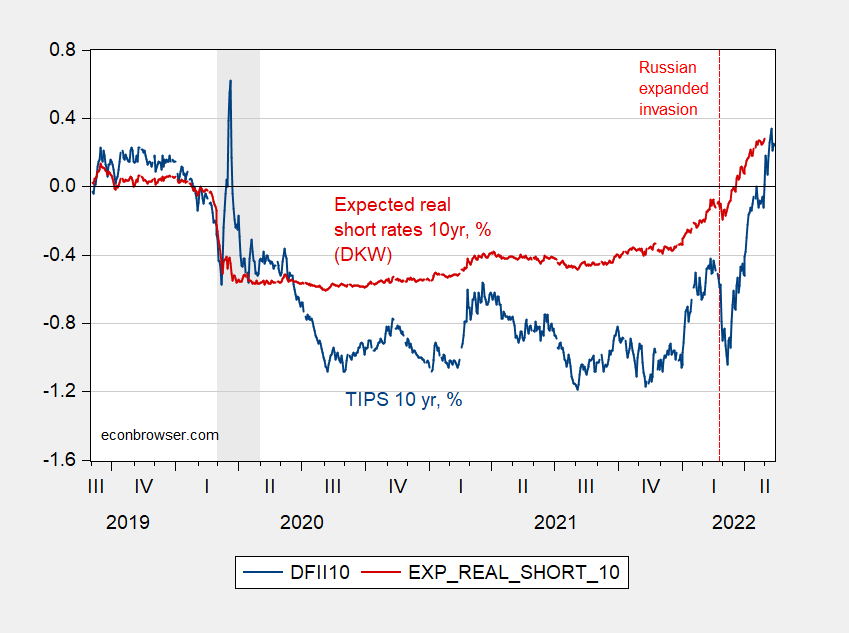
Figure 3: Ten year TIPS (blue), expected real short rates for ten years, per DKW (red), both in %. NBER defined recession dates shaded gray. Source: Treasury via FRED, KWW per DKW, NBER.
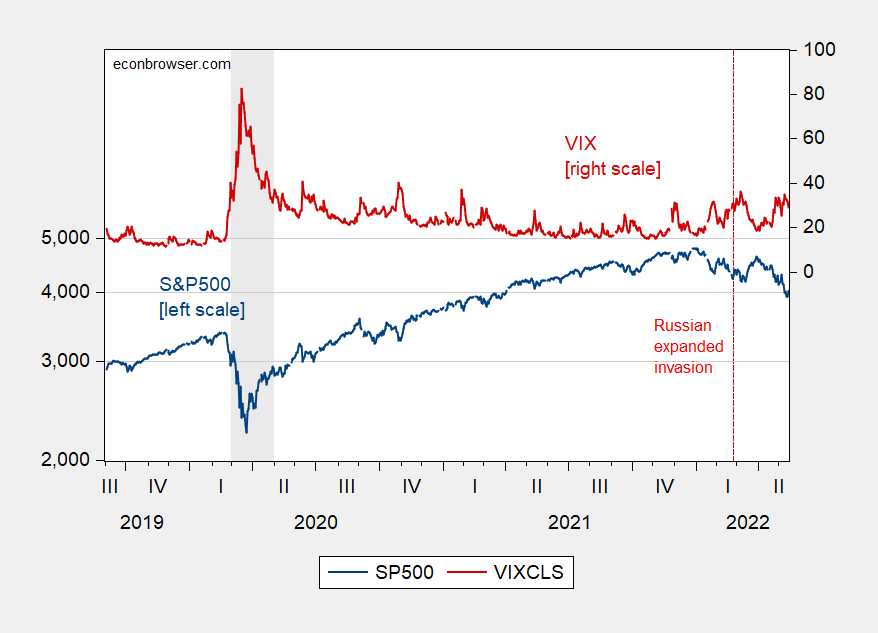
Figure 4: S&P 500 (blue, left log scale), VIX (red, right scale). NBER defined recession dates shaded gray. Source: FRED, NBER.
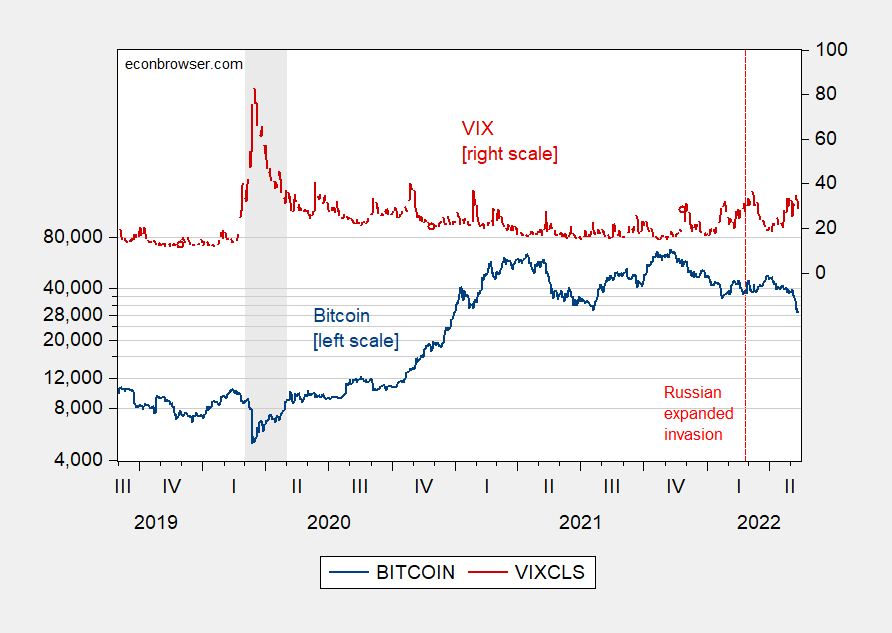
Figure 5: Coinbase Bitcoin (blue, left log scale), VIX (red, right scale). NBER defined recession dates shaded gray. Source: FRED, NBER.
The messages I take from this:
- Five-year inflation expectations have not moved up substantially.
- Expectations for economic activity are positive, with the 10yr-3mo term spread and real rates up – the latter now above zero.
- Elevated VIX and real rates imply a declining stock market, as well as cryptocurrency valuations.
- The fact that crypto has taken a bigger dive than S&P 500 in the current episode, despite the same levels of the VIX experienced earlier, indicates that other factors at work.
Disclosure: None.


