
Examining The Future Thru Futures, What Hedge Funds Buy - CoT This Week
Following futures positions of non-commercials are as of November 3, 2020.
10-year note: Currently net short 5.7k, up 21.9k.
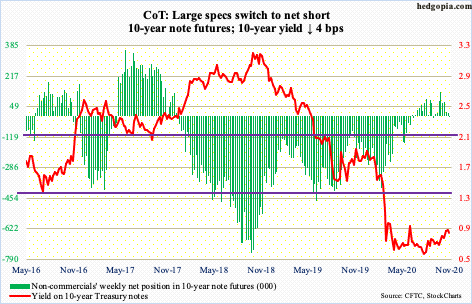
No sooner did the 10-year Treasury yield (0.82 percent) recapture the 200-day than it was lost and then gained back again. Rates rallied back above the average last Friday, before peaking at 0.90 percent on Tuesday. On Wednesday, the average (0.80 percent) was breached, but only to be reclaimed on Friday.
The last time the 10-year yielded one percent was on March 20th. Nonetheless, the very fact that it has managed to rise as high as it did must be disconcerting to the Fed.
The central bank continues to buy Treasury notes and bonds. By the week to Wednesday, it held $3.86 trillion worth, up $8.3 billion for the week. Early March, these holdings were $2.03 trillion. The Fed is buying up in an attempt to push the rates down, but the supply is rising faster.
In the 12 months to September, the budget deficit was to the tune of $3.1 trillion. A year ago, the red ink was $984.4 billion. The mismatch between receipts and expenditures is not going to get better anytime soon. If the Fed is not willing to mop up the excess supply, rates will come under upward pressure. In a leveraged economy, this does not help.
This week, non-commercials switched back to net short 10-year note futures. Bears (on price) defended resistance-turned-support at 0.75 percent.
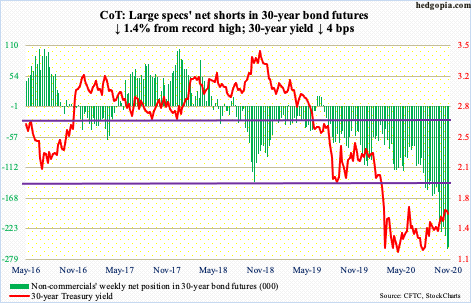
30-year bond: Currently net short 256.3k, down 3.6k.
Major economic releases next week are as follows.
Tuesday brings job openings (NFIB, October) and non-farm (JOLT, September).
Small-business job openings rose three points month-over-month in September to 36. The metric was down to 23 in May.
Non-farm openings dropped 204,000 m/m in August to 6.5 million. In May, openings were down to 5.4 million.
The CPI (October) comes out Thursday. In September, both headline and core CPI inched up 0.2 percent m/m. In the 12 months to September, they rose 1.4 percent and 1.7 percent, in that order.
The PPI (October) and the University of Michigan’s consumer sentiment index (November, preliminary) are due out Friday.
In September, producer prices increased 0.4 percent both m/m and year-over-year. Core PPI rose 0.4 percent and 0.7 percent respectively over the same time period.
Consumer sentiment in October rose 1.4 points m/m to 81.8 – a seven-month high. In April, sentiment was 10 points lower.
WTI crude oil: Currently net long 497.1k, down 24k.
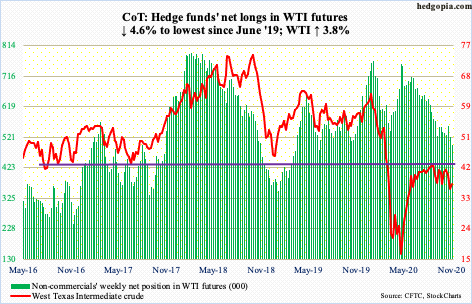
After losing important support just north of $36 last week, WTI ($37.14/barrel) went on to post a low of $33.64 intraday Monday but not before reversing higher to close just under the 200-day. By Tuesday, the average was recaptured, and by Thursday the 50-day was just about tested. Both these averages are pointing down.
Monday’s low helped form a descending channel, the upper end of which began on August 26th when the crude peaked at $43.78. This resistance gets tested at $41. For that to happen, bulls needed to take out the 50-day ($39.58), which did not happen. The crude ended the week right on the 200-day, opening the door to a possible test of $36 next week.
The EIA report for the week to October 30 showed US crude production decreased 600,000 barrels per day to 10.5 million b/d. Crude imports dropped as well – down 635,000 b/d to five mb/d. As did stocks of crude and distillates, which declined eight million barrels and 1.6 million barrels respectively to 484.4 million barrels and 154.6 million barrels. Refinery utilization increased 0.7 percentage points to 75.3 percent. Stocks of gasoline, however, rose – up 1.5 million barrels to 227.7 million barrels.
E-mini S&P 500: Currently net long 78.8k, down 36.7k.
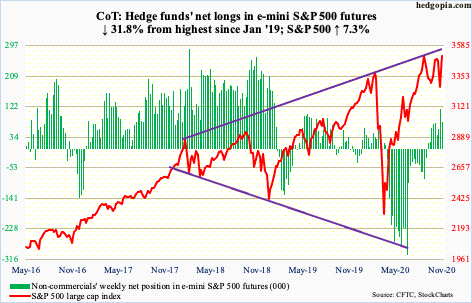
Last Friday, horizontal support at 3220s-30s was tested and defended. By then, the daily was pushed into oversold territory. Our own Hedgopia Risk Reward Index entered the green zone (see chart here).
This week, the S&P 500 shot up 7.3 percent. At one time Thursday, the large cap index was up as much as 7.9 percent. The high in that session kissed a falling trend line from September 2nd when the S&P 500 peaked at 3588.11. This was followed by a lower high of 3549.85 on October 12th. If Thursday’s high stays, a pattern of lower highs will be in place.
Interestingly, with last Friday’s low of 3233.94, there is also a higher low in place. The pattern gets tested at 3270s. On Friday, the index ended up with a doji right underneath the aforementioned trend-line resistance.
Amidst this week’s bullish action, another $5.9 billion left US-based equity funds in the week through Wednesday (courtesy of Lipper). In the same week, SPY (SPDR S&P 500 ETF), VOO (Vanguard S&P 500 ETF) and IVV (iShares Core S&P 500 ETF) collectively gained $586 million (courtesy of ETF.com).
Euro: Currently net long 140.3k, down 15.2k.
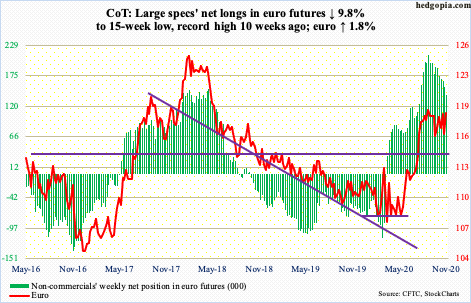
After remaining under the 50-day for seven sessions, the euro ($1.187) rallied 0.9 percent Thursday to recapture the average. Earlier on Monday, euro bulls defended the September 25th low of $1.1612.
On Friday, the currency managed to nudge past trend-line resistance from September 1st when it peaked at $1.2011, although it turned out to be a doji session right underneath the daily upper Bollinger band.
On March 20th the euro bottomed at $1.0635. The rally since that low stopped at $1.19-$1.20, which goes back to May 2003. It is only after this resistance gets taken out bulls will enjoy the upper hand.
Gold: Currently net long 242.9k, down 5.7k.
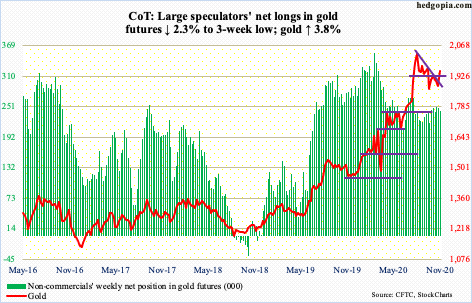
Gold ($1,951.70/ounce) broke a pattern of lower highs that have been in place since it peaked at $2,089.20 on August 7th. Thursday, it jumped 2.7 percent to also reclaim the 50-day as well as $1,920s. In September 2011, the metal retreated after posting $1,923.70. Subsequently, it bottomed at $1,045.40 in December 2015. In late July this year, that old high was surpassed, but that proved fleeting.
For one and a half months now, gold has essentially traded under $1,920s. This changed on Thursday. Bulls hope this changes the pattern of outflows GLD (SPDR Gold ETF) has experienced in recent weeks.
In the week to Wednesday, $356 million came out of GLD – its third straight weekly outflows. In the last 33 weeks, there have been eight negative weeks, for a cumulative gain of $18.3 billion. In those 33 weeks, IAU (iShares Gold Trust) had one week of outflows, for a cumulative haul of $8.6 billion, including $184 million in the week to Wednesday (courtesy of ETF.com). Longs are sitting on lots of gains.
This week’s 3.8-percent rally also helped the yellow metal break through a falling trend line from the August 7th high. For now, the daily is beginning to get extended. Friday’s trading produced a spinning top. In the sessions ahead, $1,920s may once again act like a magnet. The 50-day ($1,920.05) lies there as well.
Nasdaq 100 index (mini): Currently net long 312, up 803.
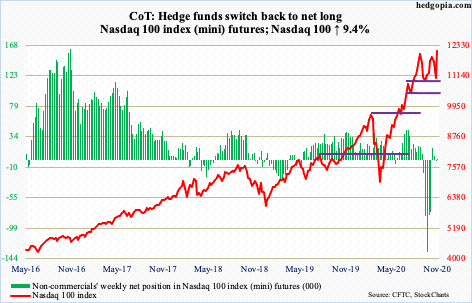
Tech bulls picked up where they left off last week. Last Friday, after suffering a three-week decline, they put foot down near 11000. Monday this week, they did that again. Then the Nasdaq 100 (12091.35) took off, gapping up on both Wednesday and Thursday. For the week, the index added 9.4 percent and was up 9.6 percent at Thursday’s high. Short squeeze likely helped (more on this here).
Be that as it may, QQQ (Invesco QQQ Trust) proceeded to lose $2.8 billion (courtesy of ETF.com). In the prior two, $3.1 billion was redeemed.
On Friday, the Nasdaq 100 managed to edge past a falling trend line from September 2nd when the index peaked at 12439.48. On October 12th, a lower high was posted at 12204.75. Thursday’s intraday high of 12117.04 establishes a pattern of lower highs. It is up to the bulls to negate the pattern. Else, shorts can get active.
Russell 2000 mini-index: Currently net long 38.3k, down 2.3k.
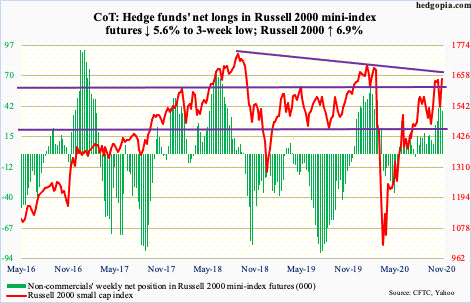
Last Friday, the Russell 2000 found support at a rising trend line from the March lows. This also approximated horizontal support at 1530s. The dual support held, with the small cap index (1644.16) going on to reclaim crucial 1600-plus, which has been an important price point going back to January 2018.
Friday’s intraday high of 1667.15 is also a higher high versus 1652.05 from October 12th, although the fact remains that just a little higher lies eight-month-old trend-line resistance, which can draw sellers.
US Dollar Index: Currently net long 741, up 2k.
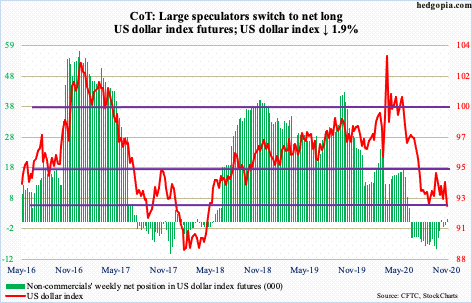
In July, the US dollar index lost a rising trend line from May 2011 when it bottomed at 72.70. In August and September, dollar bears defended that breakdown. Concurrently, bulls were unable to decisively break through 94.
For over three months now, the dollar index (92.22) has played ping pong between 94 and 92. This continued this week, with rally attempts rejected at 94.32 on Monday and at 94.33 on Wednesday. Thursday, the dollar index pierced through the 50-day to once again test the bottom of the box, which is a must-hold.
Support at 92 goes back to at least June 2003.
VIX: Currently net short 85.4k, down 19.9k.
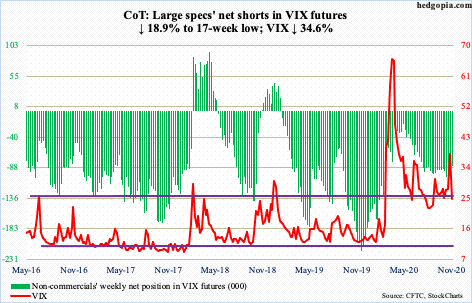
After tentative action last Thursday and Friday, volatility simply collapsed this week, down 34.6 percent, losing both the 50- and 200-day. Amidst this compression came breach Friday of a rising trend line from August 11th when the volatility index tagged 20.28 intraday. VIX (24.86) ended the week at mid-20s support. A loss raises the odds it heads toward low-20s.
The ratio of VIX to VXV ended the week at 0.91, down from 1.05 last week, which was extremely elevated. There is room for it go lower before the short-term protection investors aggressively sought ahead of the presidential election is unwound (more on this here).
Disclaimer: This article is not intended to be, nor shall it be construed as, investment advice. Neither the information nor any opinion expressed here constitutes an offer to buy or sell any ...
more

