
CoT, What Noncommercials Are Buying, Futures Positions
Following futures positions of non-commercials are as of March 2, 2021.
10-year note: Currently net short 95.6k, up 98.4k.
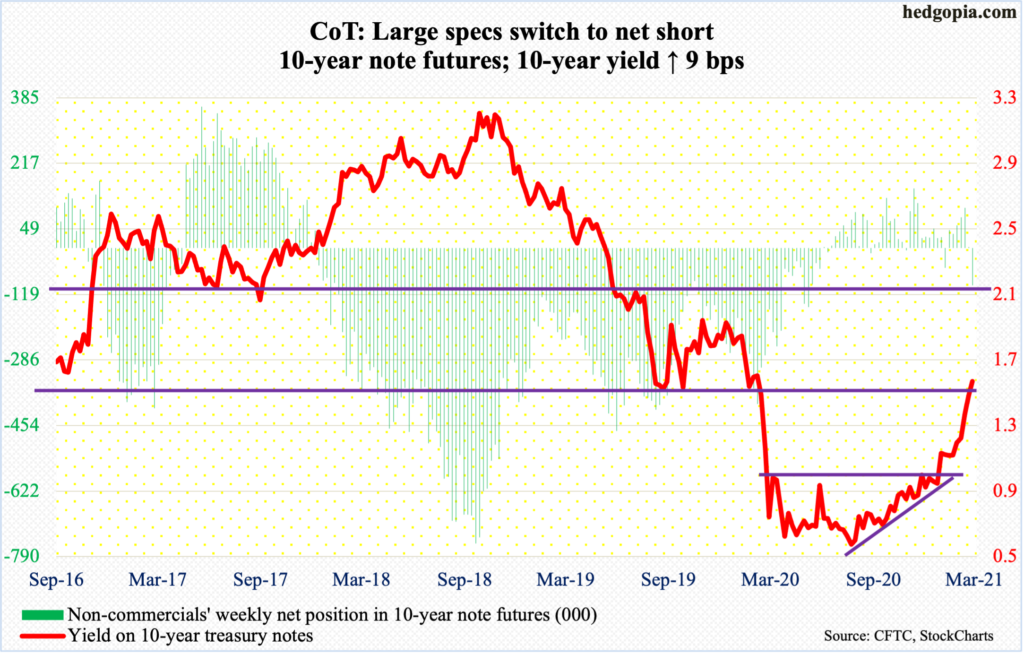
Chair Jerome Powell apparently failed to calm bond-market nerves on Thursday – or at least that is how markets’ reaction would have us believe. The S&P 500 shed 1.3 percent and the 10-year treasury yield rose eight basis points to 1.55 percent in that session.
In reality, he was as dovish as he could get, essentially saying that the expected rise in inflation will be temporary and that this will not deter the Fed from continuing with its accommodative monetary policy. Post-pandemic, growth in money supply has gone through the roof, but not the velocity (more on this here)
But markets wanted more. They don’t like the fact that long rates are rising. The 10-year touched 1.63 percent intraday Friday before closing at 1.55 percent. Forget the fact that rates were higher in January 2020.
As things stand, markets are clamoring for some version of Operation Twist, in which the Fed sells short-term notes and buys long-term notes and bonds. The fact is that the Fed already spends $120 billion/month in purchasing mortgage-backed securities and treasury notes and bonds. But markets want some level of yield curve control in which the long end is capped.
Either way one looks at it, the Fed is between a rock and a hard place. Since the 2008/2009 financial crisis in particular, they have consistently acquiesced to markets’ tantrums. The latter is addicted to the so-called monetary morphine, and it is not easy breaking a bad habit. More often than not, dislocations follow.
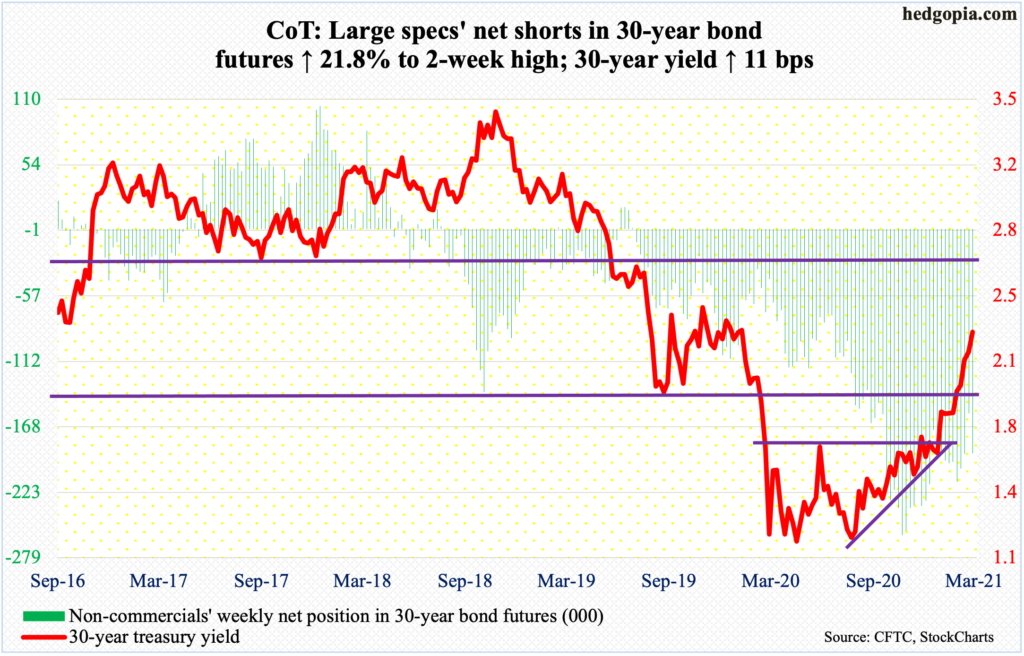
30-year bond: Currently net short 190.3k, up 34k.
Major economic releases for next week are as follows.
The NFIB Optimism Index (February) is due out Tuesday. Small-business job openings inched up a point month-over-month to 33 in January. Last May, it dropped to 23. The sub-index’s record high 39 was hit three times between December 2018 and July 2019.
The consumer price index (February) will be out Wednesday. In the 12 months to January, headline and core consumer inflation increased 1.4 percent and 1.41 percent respectively. Over December, January was up 0.3 percent and unchanged, in that order.
Thursday brings JOLTs job openings (January). Non-farm job openings increased 74,000 m/m in December to 6.65 million. Last April, openings were merely five million.
The University of Michigan’s consumer sentiment index (March, preliminary) will be published on Friday. Consumer sentiment in February declined 2.2 points m/m to 76.8. Post-pandemic, sentiment dropped to a low of 71.8 last April and rose as high as 81.8 in October.
WTI crude oil: Currently net long 549.4k, down 5.1k.
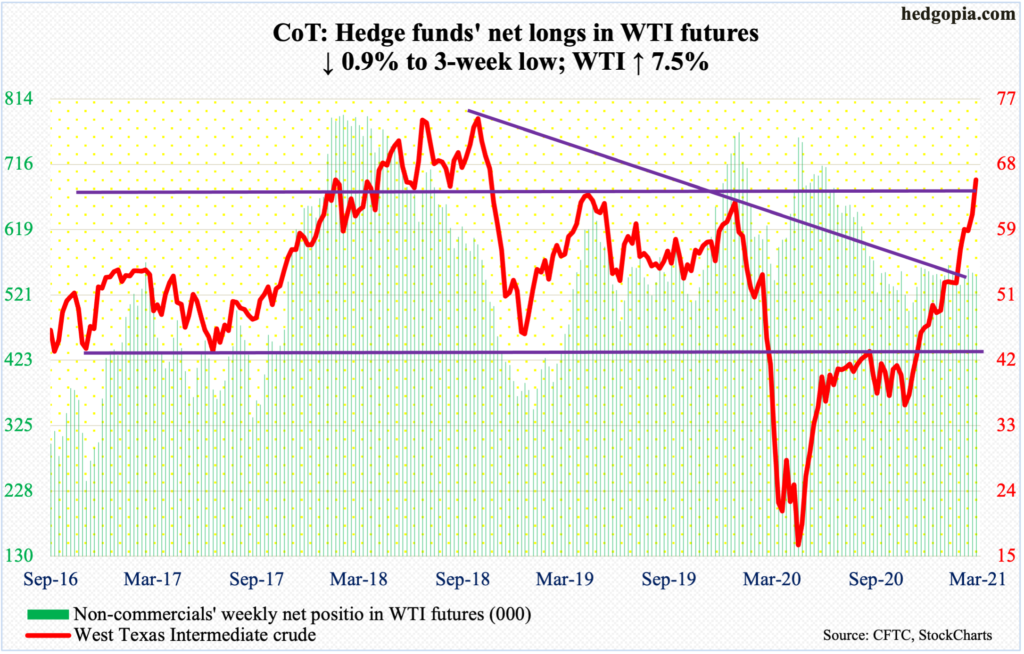
Already firm oil prices got another jolt on Thursday. OPEC+, which consists of OPEC members and non-OPEC nations such as Russia, agreed to extend production cuts for another month. In January, the alliance agreed to extend cuts to February and March. This has now been extended to April. Saudi Arabia will continue to cut its production by an extra one million barrels per day.
Ahead of this, as of February 26, US crude production increased 300,000 b/d to 10 mb/d, versus record 13.1 mb/d a year ago. The EIA data also showed crude imports rose 1.7 mb/d to 6.3 mb/d. As did crude stocks, which shot up 21.6 million barrels to 484.6 million barrels. Stocks of gasoline and distillates, however, dropped – down 13.6 million barrels and 9.7 million barrels to 243.5 million barrels and 143 million barrels, in that order. Refinery utilization tumbled 12.6 percentage points to 56 percent.
Early in the week, after facing resistance at $64 last week, WTI ($66.09/barrel) came under pressure but stabilized around its 20-day moving average. On Thursday, boosted by the OPEC+ news, it jumped 2.6 percent, followed by another 3.5-percent rally on Friday on the back of February’s better-than-expected jobs report. Bulls now have new support at $64, or just under.
E-mini S&P 500: Currently net long 23.2k, up 54.5k.
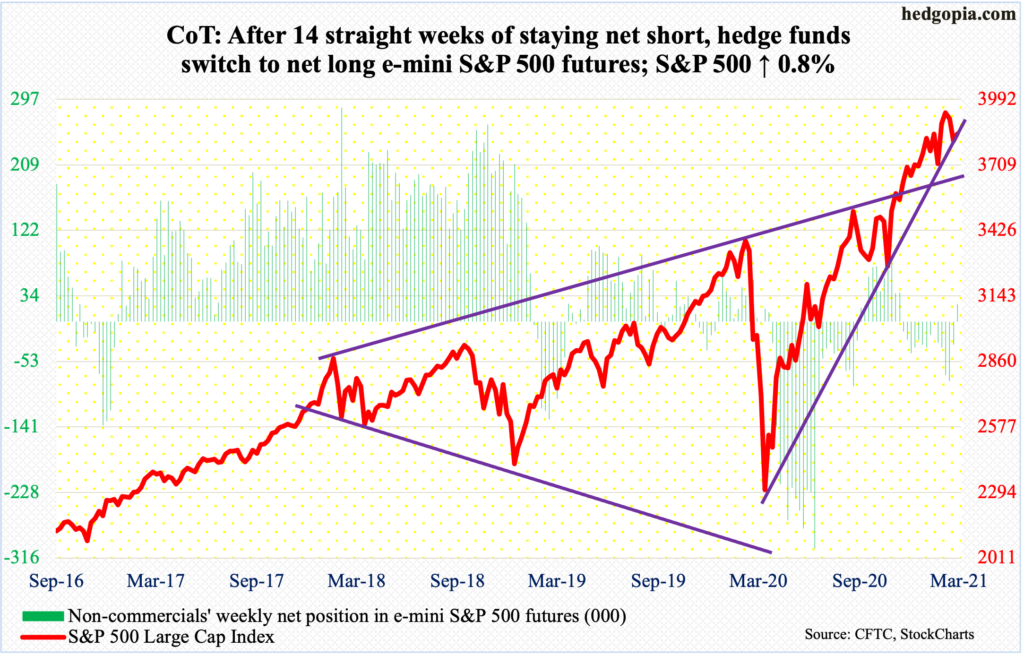
After taking in $52.6 billion in the prior three weeks – at a time when the S&P 500 was in the process of peaking – flows into US-based equity funds in the week to Wednesday this week tapered to $329 million (courtesy of ETF.com). In the same week, SPY (SPDR S&P 500 ETF), VOO (Vanguard S&P 500 ETF) and IVV (iShares Core S&P 500 ETF) collectively lost $3.4 billion (courtesy of ETF.com).
For the week, the large cap index (3841.94) rose 0.8 percent but ranged between up 2.7 percent and down 2.3 percent. In the end, the weekly formed a long-legged doji. Friday’s hammer reversal reclaimed the 50-day but ended right on a rising trend line from the low of last March.
This follows February’s monthly shooting star and January’s spinning top. Weekly and monthly indicators are grossly overbought. The daily can rally. Non-commercials are positioned accordingly. Immediately ahead, bulls and bears are likely to fight for control of 3870s-80s.
Euro: Currently net long 126k, down 12.4k.

On January 6, the euro ($1.1912) retreated after hitting $1.2345, which was the highest print since April 2018. Then, last Thursday, a lower high was made as the currency tagged $1.2243. This week, it lost 1.3 percent, for Friday’s lower low of $1.1893; on February 4, the euro turned up after hitting $1.1957.
On Tuesday, the euro rallied as high as $1.2097 before sellers showed up. Resistance at $1.20-$1.21 goes back more than 17 years. In the sessions ahead, once $1.19 is breached, the next support is not until the 200-day at $1.1789.
Gold: Currently net long 189.6k, down 26.1k.
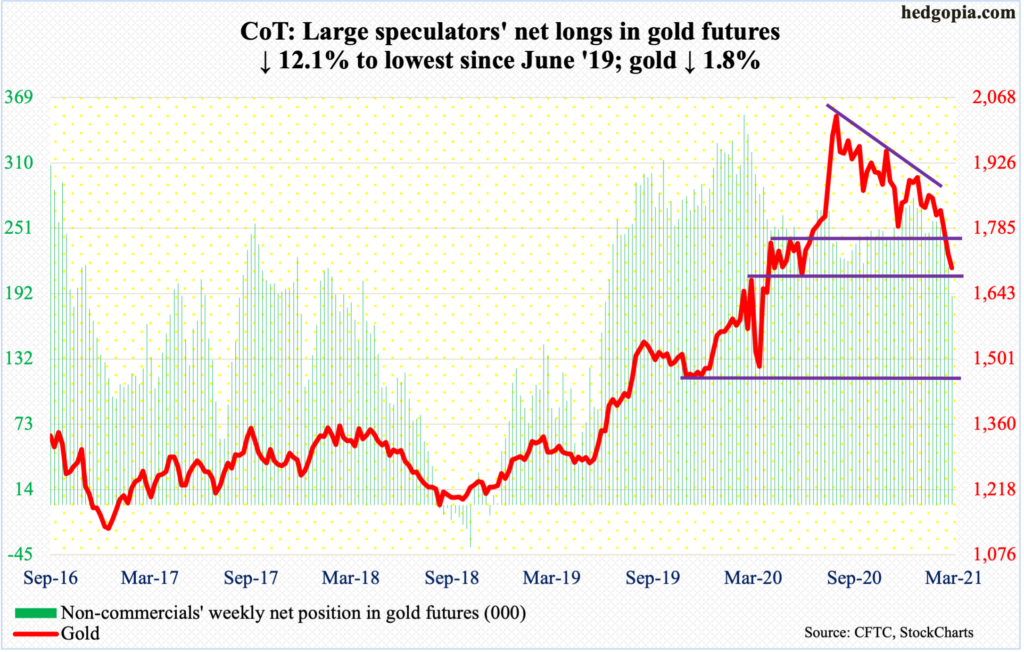
Gold ($1,698.50/ounce) on Friday traded as low as $1,683 – just about testing horizontal support at $1,670s. This preceded last Friday’s breach of $1,760s-$1,770s, which formed part of a descending triangle. The metal reached its all-time high of $2,089.20 on August 7 and has since traded within that triangle, which gave way last week.
If the pattern holds, bears could eventually be eyeing $1,440s. Hence the importance of $1,670s for now. Momentum is down. Flows are not in cooperation, with GLD (SPDR Gold ETF) experiencing outflows of $11.4 billion in the last 20 weeks (courtesy of ETF.com) and non-commercials have been reducing their net longs in gold futures. So, this is an opportunity for gold bugs to step up and make their presence felt.
Nasdaq 100 index (mini): Currently net short 23.5k, up 18.1k.
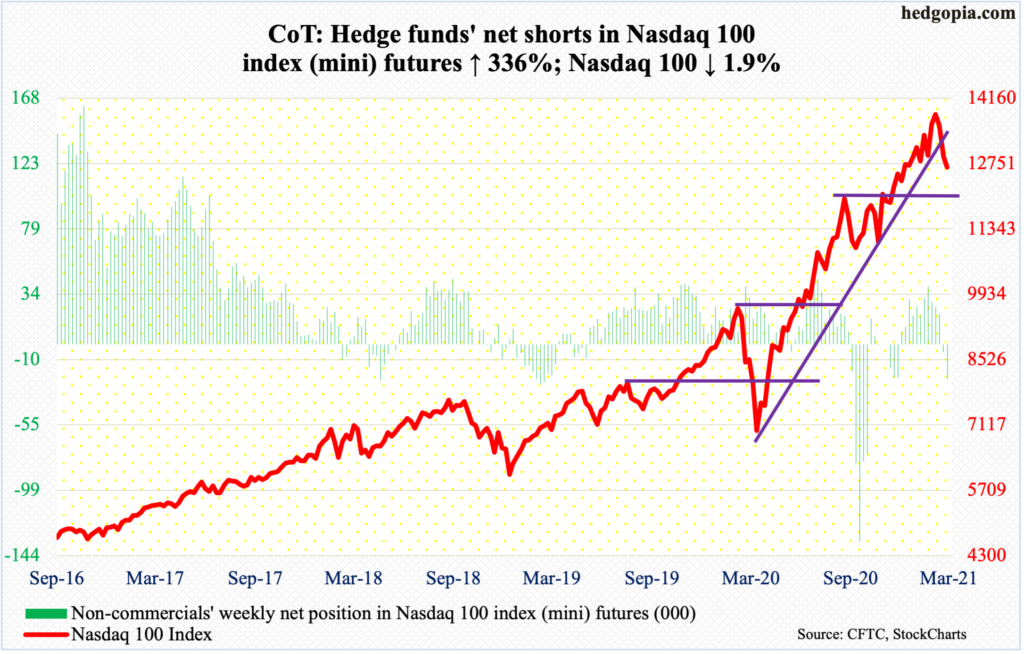
March began with Monday’s 2.9-percent surge, recapturing the 50-day. But the Nasdaq 100 last week had suffered a larger damage, losing rising trend-line support from last March. Monday’s rally proved fleeting. The 50-day was lost in the very next session. By Thursday, the tech-heavy index (12668.51) was testing 12430s, which is where it peaked on September 2 before losing 14 percent in the next three weeks. This is an important area and was defended. Friday marked a hammer reversal.
The 50-day lies at 13151.43 and can act like a magnet in the current circumstances.
Ahead of this, February produced a monthly shooting star and January a long-legged doji (more on this here).
Russell 2000 mini-index: Currently net short 14.8k, up 4.9k.
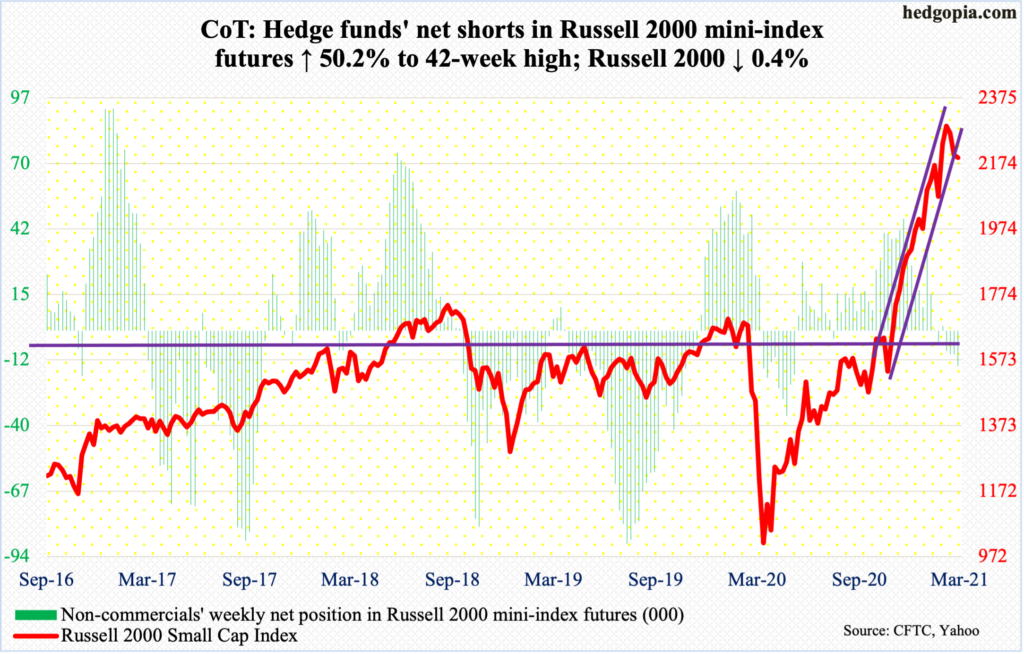
From the low of last March through the new intraday all-time high of 2318.09 on February 10, the Russell 2000 shot up 140 percent. That is in 11 months! From late October-early November, the small cap index then traded within a steep ascending channel. In late January-early February this year, bulls defended this support. Toward the end of February, their mettle was once again tested. After several sessions of push-and-pull, bulls came up short this week.
The Russell 2000 (2192.21) has dropped out of the channel but is still hanging on to short-term horizontal support at 2150s. In fact, Friday’s intraday low of 2085.12 breached this level as well as the 50-day (2149.42) but by close was able to reclaim both.
The underside of the broken channel lies at 2270s.
US Dollar Index: Currently net short 10.1k, down 3.7k.
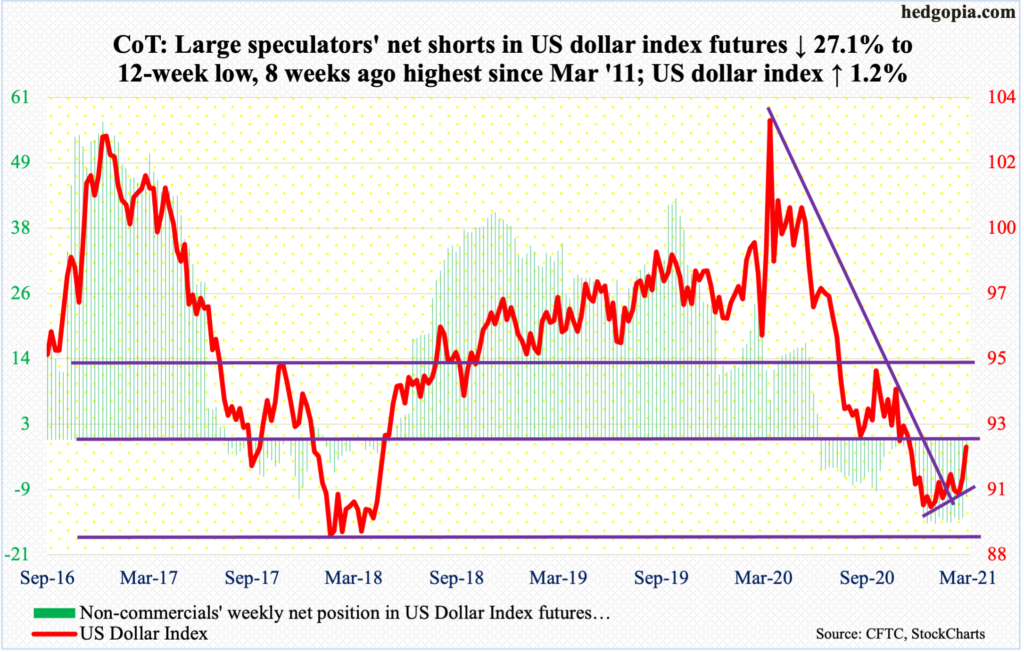
The 50-day is beginning to curl up. Concurrently, on the monthly, February formed a spinning top. This followed a successful test in January of 88-89, which goes back to at least March 2004, as the US Dollar Index bottomed on the 6th at 89.17.
Last Thursday, a higher low of 89.68 was secured. This week, the index (91.99) rallied 1.2 percent. From dollar bulls’ perspective, these are all constructive moves. They now need to reclaim 92 for continued momentum. This level was lost late November last year.
VIX: Currently net short 139k, down 23.9k.
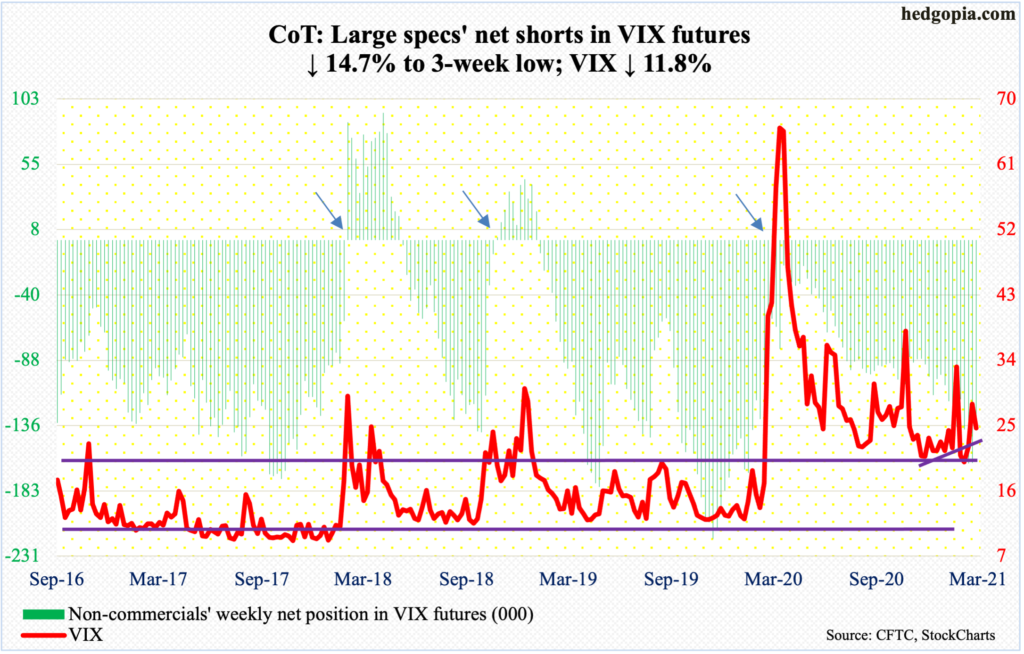
For seven months now, volatility bulls have done a good job of defending low-20s. That said, since last March when VIX tagged 85.47 intraday, a pattern of lower highs has been established. This will have been broken should 37.51 from January 29 fall. Thursday’s high was 31.90.
Friday’s intraday reversal saw VIX (24.66) lose the 200-day (26.07), but the 50-day (23.99) is intact. A loss of mid-20s once again makes it vulnerable to test low-20s.


