
Commitment Of Traders This Week, Hedge Fund Positions
Following futures positions of non-commercials are as of December 15, 2020.
10-year note: Currently net long 27.4k, down 1.8k.
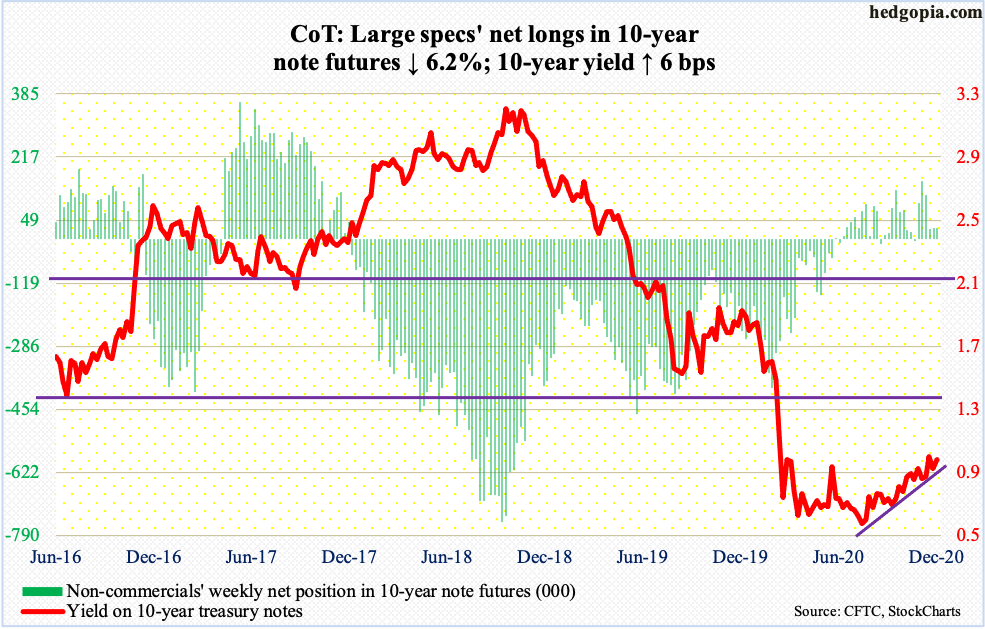
Covid-19 vaccine or not, Fed Chair Jerome Powell is not wearing rose-colored glasses as far as the US economy is concerned for the first half next year. The second half, however, should see strong growth, he says. Speaking to the press at the end of the year’s last FOMC meeting Wednesday, he once again highlighted the need for fiscal stimulus. If the need be, the Fed would adjust its quantitative easing program, but for now, would purchase at least $120 billion/month in US treasury bonds and mortgage-backed securities. The central bank is between a rock and a hard place (more on this here).
Wednesday, the 10-year treasury yield tried to rally, tagging 0.95 percent intraday but ending the session slightly lower to 0.92 percent. Rates have not been over a percent since March. Bond bears (on price) have been denied at that level several times since June, including this month and last. On the 4th this month, the 10-year yielded as much as 0.99 percent before reversing lower. With the Fed spending as much as it is in purchasing these securities, a breakout is proving hard to come by. Friday, it closed at 0.95 percent.
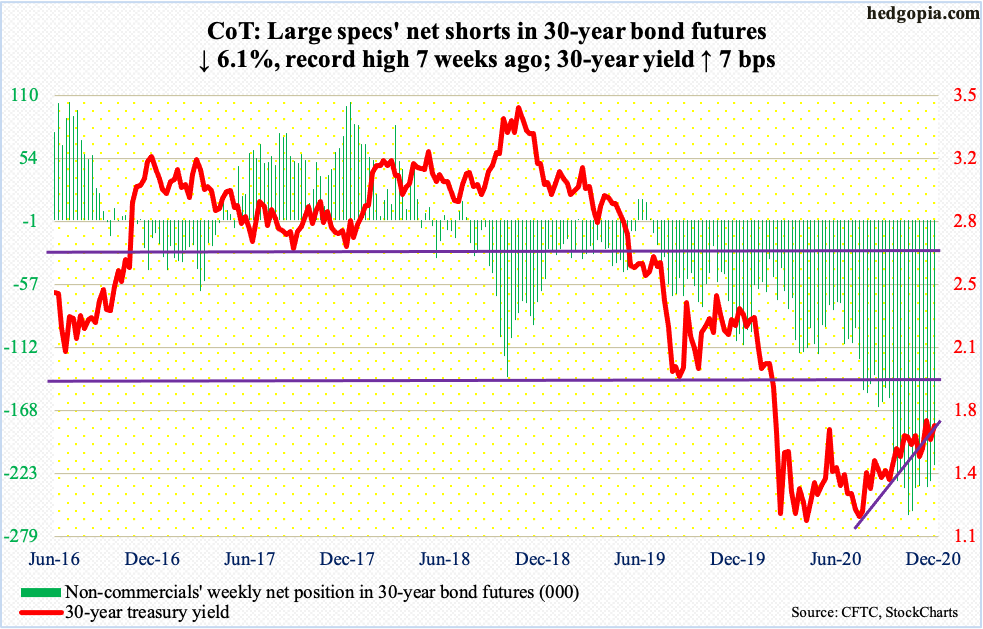
30-year bond: Currently net short 216.4k, down 14.1k.
Major economic releases for next week are as follows. Happy Holidays!
GDP (3Q20, final estimate), corporate profits (3Q20, revised) and existing home sales (November) will be published on Tuesday.
The second estimate showed the US economy grew at an annual rate of 33.1 percent in 3Q. This followed back-to-back contraction of 31.4 percent in 2Q and five percent in 1Q.
The first estimate showed corporate profits with inventory valuation and capital consumption adjustments surged 27.1 percent quarter-over-quarter in 3Q to $2.32 trillion – a new record. In 1Q and 2Q, profits tumbled 12 percent and 10.3 percent, in that order.
Sales of existing homes rose 4.3 percent month-over-month in October to a seasonally adjusted annual rate of 6.85 million units. Sales languished at 3.91 million units in May.
Personal income/spending (November), new home sales (November) and the University of Michigan’s consumer sentiment index (December, final) are due out Wednesday.
In October, core PCE, which is the Fed’s favorite measure of consumer inflation, decelerated to year-over-year growth of 1.41 percent from September’s 1.56 percent. The last time inflation grew with a two handle was in December 2018.
October sales of new homes edged lower 0.3 percent m/m to 999,000 unis. September’s 1.002 million was the highest since November 2006.
Preliminarily, December consumer sentiment increased 4.5 points m/m to 81.4. The post-pandemic low of 71.8 was recorded in April.
Thursday brings durable goods orders (November). In the 12 months to October, orders for non-defense capital goods ex-aircraft – proxy for business capex plans – increased 6.2 percent to $70.1 billion (SAAR) – a new high. Earlier in April, orders were down to $61.3 billion.
WTI crude oil: Currently net long 550.9k, down 5.4k.
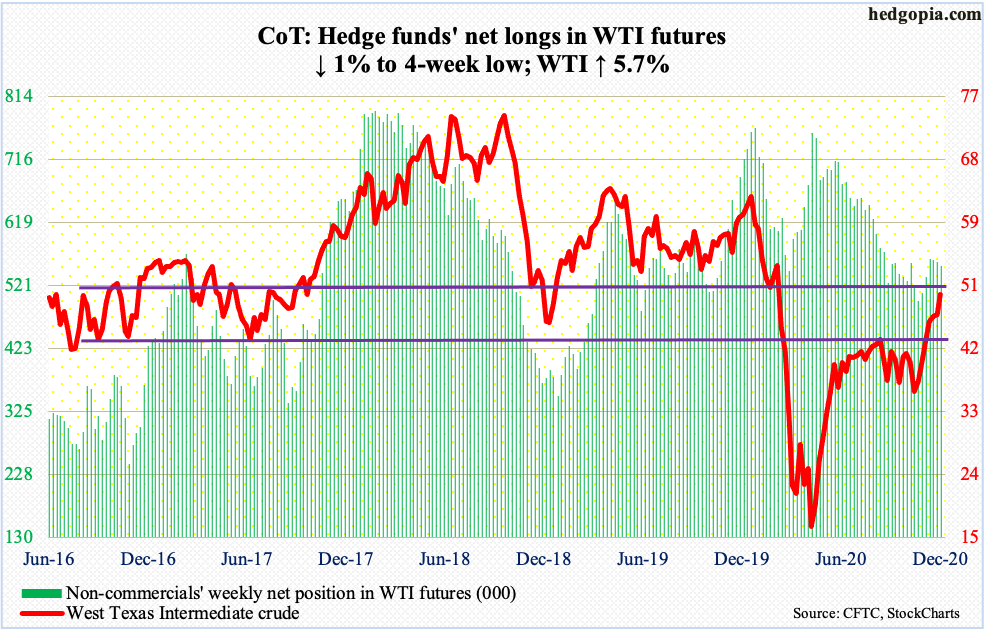
WTI ($49.24/barrel) continues to make progress toward horizontal resistance at $49-$50. Friday, the crude printed $49.43 intraday. This is the highest price point since late February. Since bottoming at $33.64 intraday on November 2, WTI has just about gone vertical, with seven consecutive up weeks. Four weeks ago, it broke out of crucial resistance at $42-$43. Bulls have the momentum. Bears are likely to try their luck around here. The daily is way extended.
The EIA report for the week to December 11 showed US crude production, imports and stocks all fell – respectively down 100,000 barrels per day, 1.1 million b/d and 3.1 million barrels to 11 mb/d, 5.4 mb/d and 500.1 million barrels. Stocks of gasoline and distillates, however, rose – up one million barrels and 167,000 barrels to 238.9 million barrels and 151.3 million barrels. Refinery utilization dropped eight-tenths of a percentage point to 79.1 percent.
E-mini S&P 500: Currently net short 34.7k, down 8k.
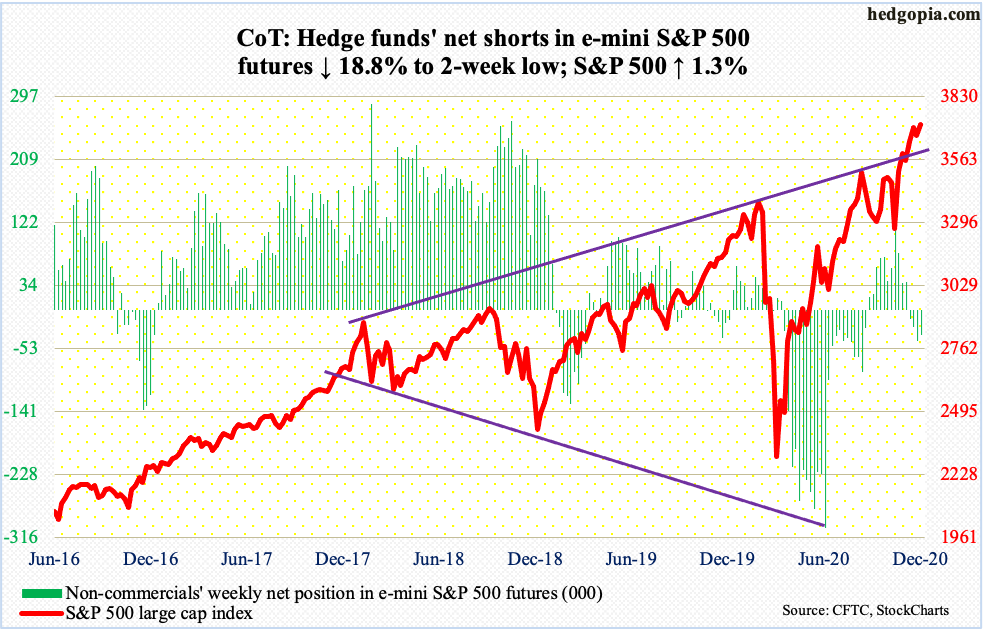
In the week to Wednesday, SPY (SPDR S&P 500 ETF), VOO (Vanguard S&P 500 ETF) and IVV (iShares Core S&P 500 ETF) collectively lost $1.7 billion (courtesy of ETF.com). In the same week, $54.4 billion came out of US money-market funds (courtesy of ICI). Equity bulls often cite the massive ‘cash-on-the-sidelines’ as one of the reasons for their optimism. These money-market funds peaked at $4.79 trillion in the week to May 20. Since then, $500.5 billion has left, and the S&P 500 has added 750 points. That said, US-based equity funds during the period experienced redemptions of $88.2 billion, even as taxable bond funds took in $213.7 billion, investment-grade corporate funds $172.4 billion and high-yield funds $24.7 billion, among others (courtesy of Lipper).
Amidst these not-so-bullish flow dynamics for equities, the S&P 500 (3709.41) made yet another intraday high of 3726.30 on Friday. For three consecutive sessions through Monday, bulls defended 3640s, which led the foundation for the rally in the subsequent sessions. This price point is important in that on November 9 when Pfizer (PFE) announced its positive vaccine news the large cap index reversed lower after tagging 3645.99. Another relevant price point lies in 3580s, which is where the S&P 500 peaked on September 2. As long as the price remains above these levels, bulls deserve the benefit of the doubt.
Next week, they may need to save the 10-day moving average, which was tested on Friday. But with the daily once again overbought, their mettle will be tested.
In the meantime, at least through October, foreigners continued to raise exposure to US stocks (more on this here).
Euro: Currently net long 141.8k, down 14.6k.
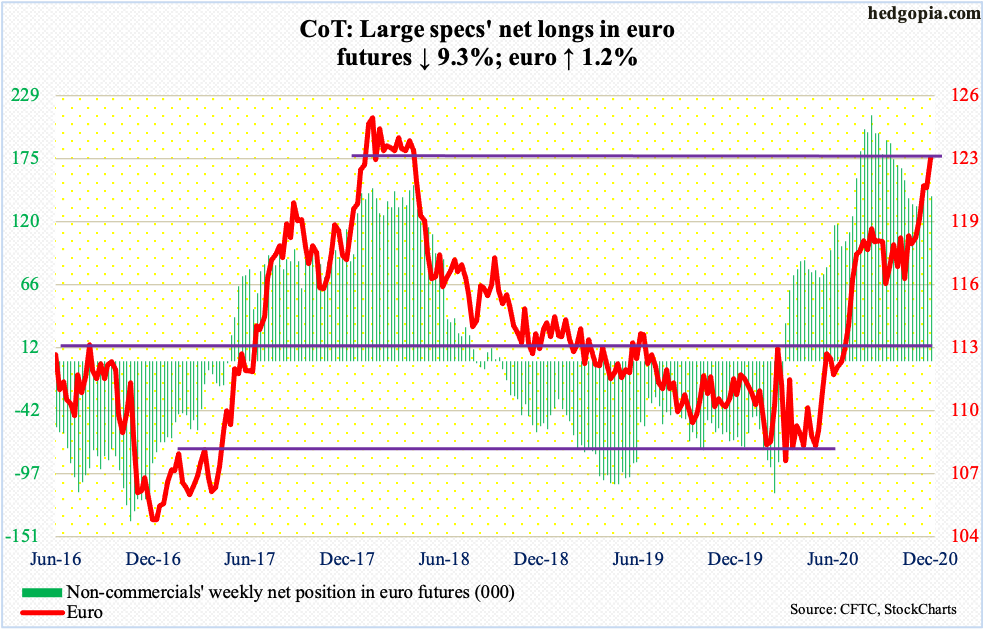
Euro bulls enjoyed yet another mini breakout this week – out of $1.2170s. Thursday’s gap higher followed defense of the rising 10-day for six sessions, with the intraday high of $1.2274 edging past resistance at $1.21-$1.22.
The euro ($1.2261) remains extended on nearly all timeframes, but bulls carry the momentum and could very well be eyeing the January 2018 intraday high of $1.2537.
Gold: Currently net long 271.6k, up 2.4k.
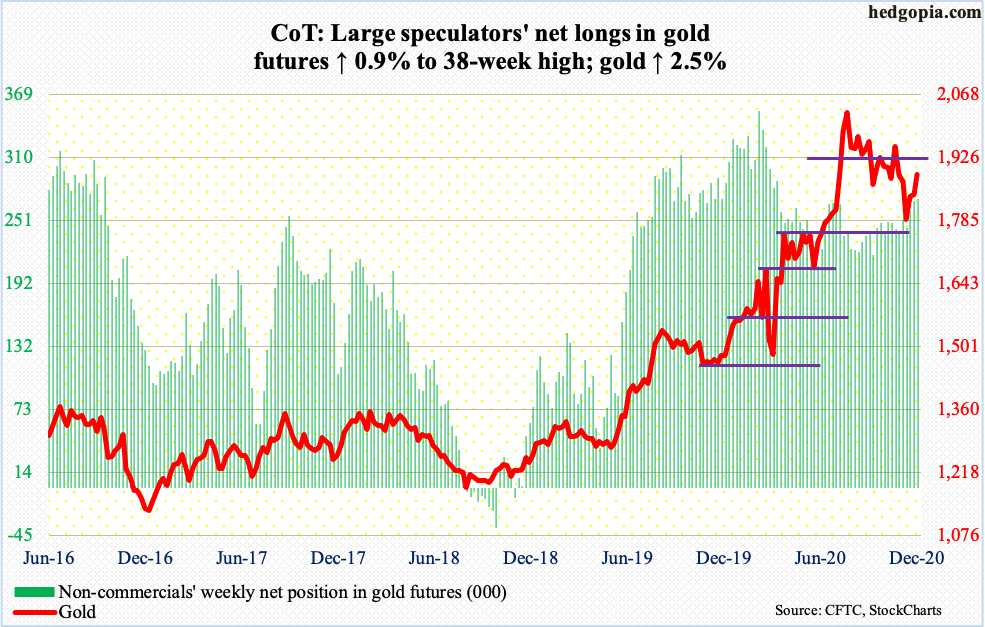
Having rejected at the 50-day last week, the 200-day was tested this Monday – successfully. The rally off of that test led to the reclaiming of the 50-day on Thursday when gold ($1,888.90/ounce) rallied 1.7 percent – past $1,850s.
Gold bugs’ next major test lies at $1,920s, which is where it peaked in September 2011. The yellow metal surpassed that high in July, subsequent to which it made a new all-time high of $2,089.20 on August 7. A falling trend line from that high was unsuccessfully tested Thursday when it tagged $1,902 intraday.
Since bottoming at $1,767.20 on November 30, gold has shown constructive price action. This is yet to stop GLD (SPDR Gold ETF) from bleeding. In the week to Wednesday, another $570 million was withdrawn. This was the ninth straight weekly loss, for a cumulative withdrawal of $6.4 billion. Even after this, GLD is still up $13.5 billion in the last 39 weeks. In late March, gold bottomed at $1,450.90. In those 39 weeks, IAU (iShares Gold Trust) experienced four weekly outflows, including $88 million in the week to Wednesday, for total inflows of $8.3 billion (courtesy of ETF.com). Longs obviously have tons of paper gains in these ETFs, and have been tempted to lock them in. GLD in particular has been a victim of this. It is possible the exodus stops if gold recaptures $1,920s. For now, the daily is overbought.
Nasdaq 100 index (mini): Currently net long 12k, up 3k.
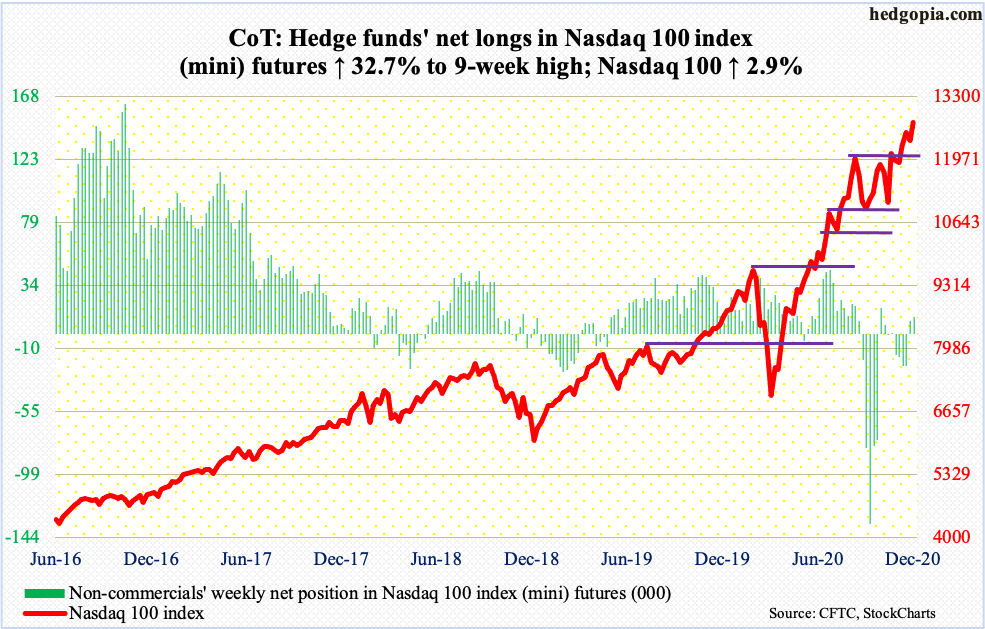
On Tuesday, bids showed up near the prior high of 12439.48 from September 2. Then on Thursday, intraday weakness was bought near the December 8 high of 12651.35. Come Friday, a fresh intraday high of 12793.47 was achieved but bulls were unable to hang on to the gains; however, they rallied the index one percent in the last 20 minutes to end the session down only 0.1 percent. In the end, Friday produced a hanging man, which is potentially bearish but needs confirmation.
Since November 9 when PFE announced its positive vaccine news, tech has not been its usual self, although the Nasdaq 100 (12738.18) managed to trudge to fresh highs. In the sessions ahead, bulls may be forced to once again defend 12650s and 12430s.
Russell 2000 mini-index: Currently net long 15.9k, down 11.4k.
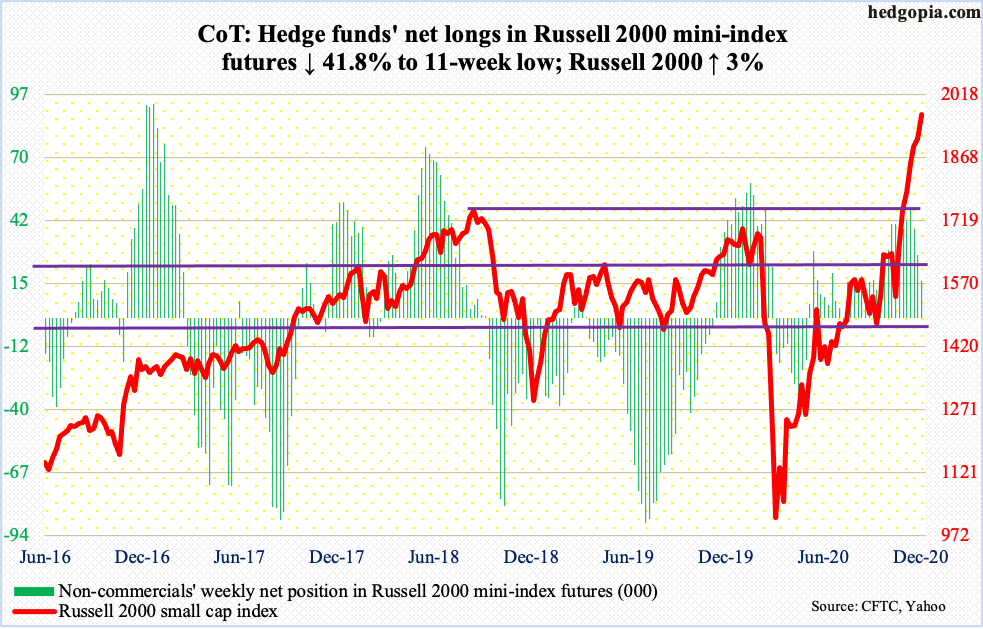
After bottoming late October/early November at 1530s, the Russell 2000 (1969.99) has rallied in a classic stair-step fashion. Yet another intraday high of 1992.72 was scored on Friday. From its March bottom, it has more than doubled!
On its way here, the small cap index recaptured 1600-plus, which has been an important price point going back to January 2018, and 1740s, which is where it peaked back in August that year. Most recently, it broke out of 1850s two weeks ago, and 1920s this Tuesday.
Post-November 3 presidential election in general and the vaccine news in particular, small-caps have been a go-to sector. From November 4 through this Wednesday, IJR (iShares Core S&P Small-Cap ETF) attracted $2.3 billion and IWM (iShares Russell 2000 ETF) $3.8 billion (courtesy of ETF.com).
Needless to say, this is increasingly becoming a crowded trade, although non-commercials have been cutting back in recent weeks. Thursday, the Russell 2000 was 33.9 percent from its 200-day – a new record. As extended as the index is on nearly all timeframes, there are no major signs of distribution just yet.
US Dollar Index: Currently net short 14.1k, up 7.6k.
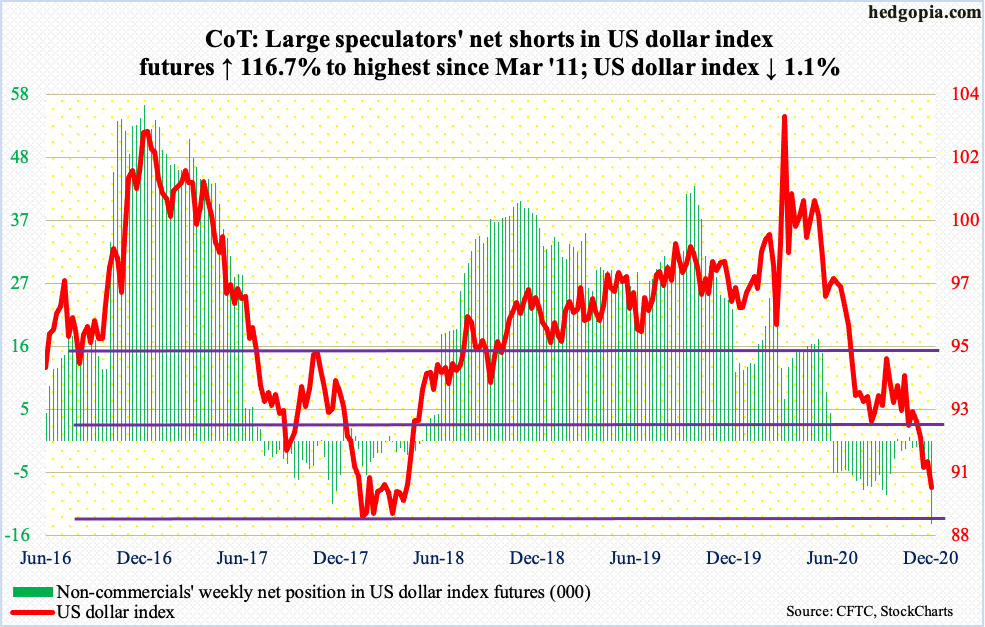
Horizontal support at 88-89 is being tested. On Thursday, the US dollar index (89.95) made an intraday low of 89.64. It has not traded this low since April 2018. In January through April that year, the index dropped to just north of 88 several times. As a matter of fact, this support goes back to at least March 2004.
Late last month, the US dollar index lost crucial support just north of 92, which goes back to at least June 2003. Even earlier, in March this year, it peaked at 103.96. So, it has come down quite a bit. But dollar bulls are yet to doggedly put their foot down. They have an opportunity to do so right here.
In the event a relief rally ensues in the sessions ahead, bears are likely to show up at 90.50s.
VIX: Currently net short 113.2k, up 13.4k.
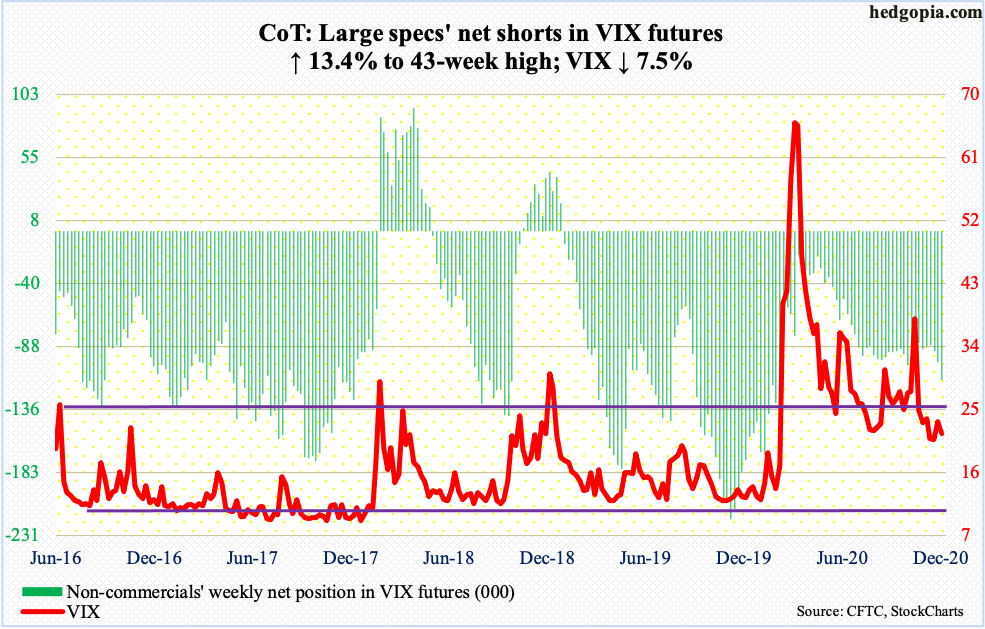
After defending 20 for nearly two weeks, VIX rallied strongly last week, except it closed poorly on Friday, with the close of 23.31 substantially below the intraday high of 25.14. This Monday, the volatility index once again tested mid-20s, which would not give way. By Thursday, VIX (21.57) tagged 21.52 intraday, closing back below both the 10- and 20-day. Friday’s rally attempt failed as well, with the session ending with a shooting star. In the holiday-shortened next week, volatility bears likely will try to once again push it down toward 20.
In the meantime, the 21-day moving average of the CBOE equity-only put-to-call ratio keeps making new lows, as it dropped to 0.407 on Thursday. Just wow! Greed rules. Giving credit where it is due, it has been right to be greedy. But this is also setting up for a painful ending. Only the nimble ones will survive once greed makes way for fear.
This blog is not intended to be, nor shall it be construed as, investment advice. Neither the information nor any opinion expressed here constitutes an offer to buy or sell any security or ...
more

