
Commitment Of Traders Report: Futures Positions, What Hedge Funds Are Buying
Following futures positions of non-commercials are as of October 27, 2020.
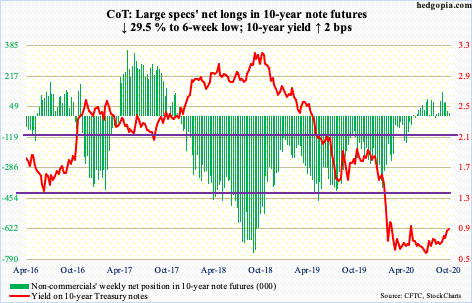
10-year note: Currently net long 16.2k, down 6.8k.
The FOMC meets next week. After this, only one meeting remains this year, slated for December 15-16.
It will be interesting if Wednesday’s statement – or Chair Jerome Powell later in the news conference – care to mention how they view the recent spike in the long end of the yield curve.
The last meeting took place on September 15-16, when the 10-year Treasury yield stood at 0.69 percent. On October 23rd, these notes were yielding 0.87 percent, with Friday at 0.86 percent. Between the periods, the 30-year yield went from 1.45 percent to 1.69 percent, with Friday at 1.64 percent. On March 9th, they respectively bottomed at 0.40 percent and 0.84 percent. The yield curve has steepened.
Rates have rallied even as the Fed continues to purchase Treasury notes and bonds. In the week to Wednesday, it held $3.85 trillion worth, up $15.9 billion for the week. Early March, these holdings were $2.03 trillion.
If the recent jump in these rates is the beginning of a trend, the Fed will have its hands full. As leveraged as the economy is, with national debt north of $27 trillion, corporate debt at $11 trillion and household debt north of $16 trillion, higher rates will bite.
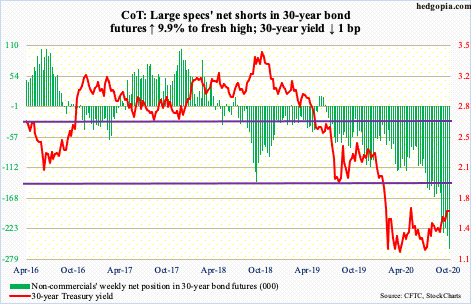
30-year bond: Currently net short 260k, up 23.3k.
Major economic releases next week are as follows.
The ISM manufacturing index (October) is due out Monday. Manufacturing activity in September edged down six-tenths of a point from August’s 21-month high 56.
Durable goods orders (September, revised) are scheduled for Tuesday. Preliminarily, September orders for non-defense capital goods ex-aircraft – proxy for business capex plans – rose 4.5 percent year-over-year to a seasonally adjusted annual rate of $68.7 billion, which is a six-year high.
The ISM non-manufacturing index will be published Wednesday. Services activity in September rose nine-tenths of a point month-over-month to 57.8.
Labor productivity (3Q20) is on tap for Thursday. Non-farm output/hour jumped 9.7 percent in 2Q. This was the fastest growth rate since 1Q71.
Friday brings employment data (October). The US economy has gained back half of the non-farm jobs lost post-pandemic. Between February and April, 22.2 million jobs were lost. Between April and September, 11.4 million were added.
WTI crude oil: Currently net long 521.1k, down 35.1k.
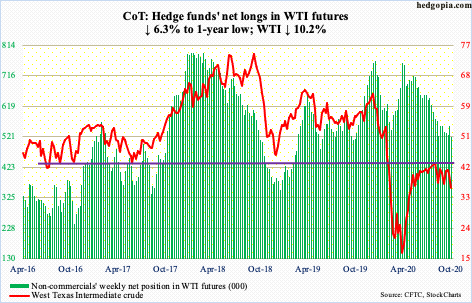
After having failed at the 50-day moving average last week, WTI ($35.79/barrel) quickly unraveled this week, slicing through the 200-day on Wednesday. On Thursday, the crude dropped all the way to $34.92 intraday but managed to close near crucial support. Early September as well as early October, WTI bottomed just north of $36 before rallying.
Prior to this week’s 10.2-percent collapse, WTI was rangebound between $41-$42 and $36. Even if the crude manages to rally here, the damage is done. Both the 50- and 200-day are dropping. Resistance is galore, with the 200-day at $37.58, followed by straight-line ceiling at $39.
The EIA report for the week to October 23 showed US crude production increased 1.2 million barrels per day to 11.1 mb/d. As did crude imports, which rose 546,000 b/d to 5.7 mb/d, and crude stocks, which rose 4.3 million barrels to 492.4 million barrels. Stocks of gasoline and distillates, however, fell – down 892,000 million barrels and 4.5 million barrels respectively to 226.1 million barrels and 156.2 million barrels. Refinery utilization increased 1.7 percentage points to 74.6 percent.
E-mini S&P 500: Currently net long 115.4k, up 57.6k.
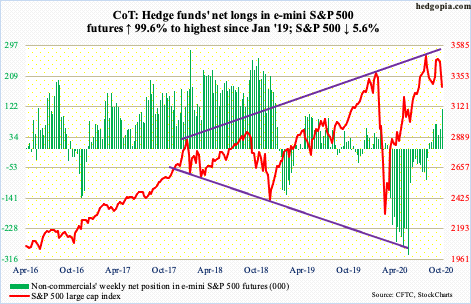
The week began with Monday’s slight breach of the 50-day on the S&P 500 (3269.96), which likely led to Wednesday’s 3.5-percent mini-collapse. Friday’s intraday low of 3233.94 attracted some buying, defending support at 3220s-30s. This is a small consolation for bulls, but in all probability this is not the end of selling.
Longer-term, this week’s price action preceded a lower high on October 12th versus the all-time high of 3588.11 on September 2nd. The latter was rejected at the top of an ascending broadening wedge (more on this here). A breach of 3220s, not to mention the 200-day at 3129.47, can accelerate selling. Near-term, the daily is oversold. Bulls hope fund flows begin to cooperate.
In the week to Wednesday, SPY (SPDR S&P 500 ETF), VOO (Vanguard S&P 500 ETF) and IVV (iShares Core S&P 500 ETF) collectively lost $2.4 billion (courtesy of ETF.com), even as US-based equity funds lost $11 billion (courtesy of Lipper).
Euro: Currently net long 155.6k, down 10.4k.
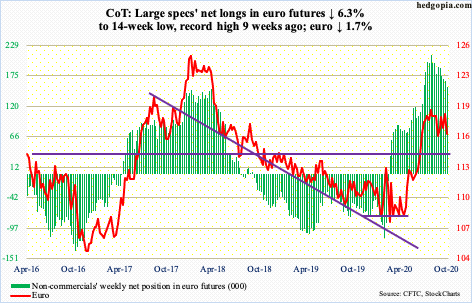
Once again, the euro ($1.1658) failed to stay above the 50-day ($1.1786). After remaining above the average for five sessions, a breach occurred on Tuesday. By intraday Friday, it was down to $1.1639. With this, horizontal support at $1.17-$1.175 was lost. Ditto with trend-line support from September 25th when the currency dropped to $1.1612, a loss of which opens the door to a test of $1.14-$1.15.
Earlier, although it did rally to $1.2011 on September 1st, the euro got denied at $1.19-$1.20 for three months. This resistance goes back to May 2003. On March 20th the euro bottomed at $1.0635.
Longer-term, the currency remains overbought on the monthly.
Gold: Currently net long 248.6k, down 1k.
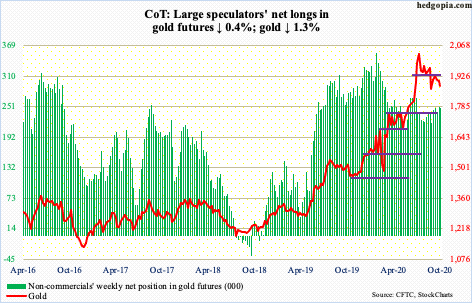
Gold ($1,879.90/ounce) came very close to losing $1,850s, with Thursday printing $1,859.20 intraday. Since peaking at $2,089.20 on August 7th, the metal has made lower highs, with a low of $1,851 on September 24th. A loss of $1,850s can begin a new round of selling. Should a breach occur, there is decent support at $1,770s, with the 200-day at $1,773.77.
GLD (SPDR Gold ETF) is beginning to bleed. In the week to Wednesday, $682 million was withdrawn. This followed redemption of $499 million in the prior week. These make up two of the seven weekly outflows in the last 32, for a cumulative gain of $18.7 billion. In those 32 weeks, IAU (iShares Gold Trust) had one week of outflows, for a cumulative haul of $8.5 billion, including $199 million in the week to Wednesday (courtesy of ETF.com).
Gold bottomed at $1,450.90 32 weeks ago. These longs are sitting on lots of gains. Bulls’ inability to recapture $1,920s after repeated attempts is not a morale-booster. A loss of $1,850s can aggravate sentiment.
Nasdaq 100 index (mini): Currently net short 491, up 6.6k.
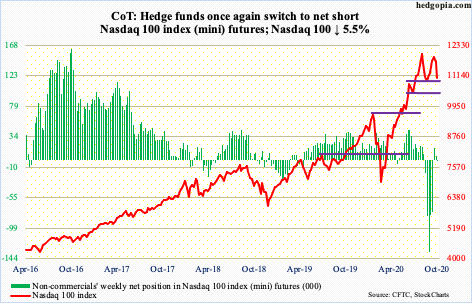
On September 2nd, the Nasdaq 100 peaked at 12439.48. This was followed by a lower high of 12204.75 on October 12th. This week, the 50-day was lost in Wednesday’s 3.9-percent down session. For the week, the index (11052.95) shed 5.5 percent. Support just north of 11000 is still intact, but the price action in recent weeks suggests it is just a matter of time before it is lost.
At least going by Investors Intelligence bullish percent, investor sentiment remains elevated (more on this here).
In September, too, 11000 was breached, with a low of 10677.85 on September 21st, but tech bulls soon regrouped to launch a rally that culminated in the aforementioned October 12th high. In general, the more a support is tested, the higher the odds it gives way.
In the week to Wednesday, $1.3 billion came out of QQQ (Invesco QQQ Trust). This was preceded by a loss of $1.8 billion in the prior week (courtesy of ETF.com).
Russell 2000 mini-index: Currently net long 40.6k, down 231.

After pushing through and remaining above crucial 1600-plus for 12 sessions, the Russell 2000 (1538.48) could no longer defend breakout retest this week (more on this here). Small-cap bulls can draw solace in the fact that horizontal support at 1530s was tested and saved – for now.
Wednesday’s selling also pierced through the 50-day (1561.33). It remains to be seen if shorts begin defending the average, which they did do on both Thursday and Friday. Before that, they denied longs an opportunity to convert a potentially bull flag.
US Dollar Index: Currently net short 1.3k, down 412.
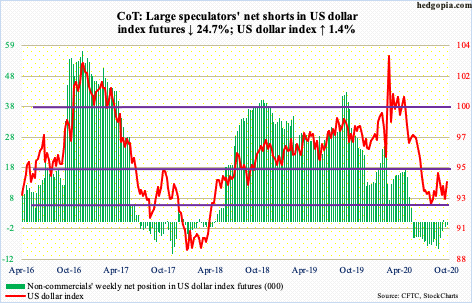
Dollar bulls are not in a mood to lose 92. Last Wednesday, the US dollar index dropped to 92.46 intraday. A week later, the 50-day (93.36) was reclaimed, followed by a 0.6-percent rally on Thursday. The average is now curling up. Support at 92 goes back to at least June 2003.
For three months now, the index (94.04) has played ping pong between 94 and 92. A breakout hence will be important. Immediately ahead, bulls will be eyeing 94.80 from September 25th, followed by 95.71, which was a low from June 10th. By that time, the dollar index would have made higher highs.
VIX: Currently net short 105.3k, down 2k.

When volatility rises, it can do so quickly.
For the week, VIX jumped 38 percent and was up as much as 49.4 percent at Thursday’s high. The intraday high of 41.16 in that session was the highest since June 15th when VIX peaked at 44.44.
Thursday also produced a spinning top with a very wide range. If volatility takes a breather near term, 36 is the one to watch.
Longer-term, both the 50- and 200-day are rising. On the monthly, several indicators including the RSI and stochastics have turned up from the median. Near-term notwithstanding, volatility’s path of least resistance is up.
Disclaimer: This article is not intended to be, nor shall it be construed as, investment advice. Neither the information nor any opinion expressed here constitutes an offer to buy or sell any ...
more

