
Charts: Short-Term Trends, Longer-Term Outlook
The Short-Term Trend
The short-term trend continues. It is getting a bit long in the tooth, but it seems to be gathering strength.
[long in the tooth: A horses' gums recede and their teeth appear longer as they grow older, owing to their constant grinding of their food is the idea behind this ancient folk phrase, which means one is getting on]

The six major indexes shown below are now all above their 50-day averages. That's a show of strength.

It looks like the recent market strength revealed itself on Tuesday as it broke out of a mini base.

The Long-Term Outlook
The semiconductors have rallied back to their breakdown level. Is this strength or a classic retrace?

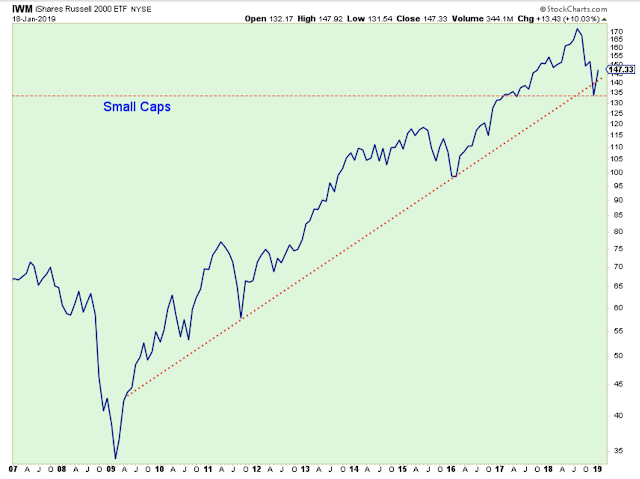
The small caps broke down briefly, but now they are back into their previous uptrend. Is the downtrend broken? Are the small caps now building a new multi-month base?
Junk Bonds have rallied, and it is hard to believe but they are now pushing up against their highs! This is bullish for the general market. And what an incredible rally too. Straight up off their lows. Is that a bear market style rally? Or is it a quick realization by investors that an enormous bargain had developed?

The price of Junk Bonds are under the spell of the price of oil. If oil prices go too low, Junk Bonds sell off, and vice versa.

The Summation Indexes are now in, or close to the green. This is where the market gives you permission to be more optimistic about stock prices. But we have seen this indicator go green only to turn around lower again, so false alarms are not rare.

Even though the market backdrop has a improved a bit, let's not forget about the technical signals that warn us that there are problems in the market.
Below is a 20-year chart. The red arrows in the bottom panel shows that there have only been four ticks lower for the 52-week price channel in the 20-year time period. And the downticks all occurred while the ECRI Index was in the range below the zero-level.
So these downticks combined with weak ECRI readings are rare and important. The two from over 10 years ago showed the start of major moves lower. The one in 2015 was a false alarm, and I remember it well.
The market looked like it was in a free fall, and then just turned higher. In 2001 and 2008, the ECRI continued to move lower which helped confirm the stock market downtrend. But in 2015, the ECRI wasn't as weak and didn't continue moving lower as it did in the other market sell offs. So it didn't confirm the market downtrend, and, sure enough, after a few months stock prices were up and running again.
Now? We have another downtick, and we have another weak ECRI Index. I think the key here is to watch the ECRI index. It should really help guide us over the next few months.
(Side note. Also watch the 52-week lows. Markets don't sell off without a substantial number of new 52-week lows.)

There you have it. My view of the general market and what to look for.No predictions. No sales pitch. No hanging onto a bull or bear outlook just to prove I was right or wrong. And, speaking of being wrong...
Gold
My gold trade did not work out. A couple weeks ago I thought we might finally get a sustained rally for the gold miners based on increased growth in the M2 money supply. But the chart below would suggest otherwise. At least for now.
Yes, I am one of those people fascinated by gold. I don't know why, I am not proud of it, but there it is. Maybe I watch gold because I have this irrational fantasy that gold is place where I can hide when things go wrong in the world.

Outlook Summary:
The long-term outlook is negative, but there is a whiff of strength.
The medium-term trend is up as of Jan-4.
The short-term trend is up as of Dec-26.
The medium-term trend for bond prices is up as of Nov-16 (prices higher, yields lower).
Investing Themes:
Cash
Inverse Funds
Strategy During a Bull Market:
- Buy large cap stocks and ETFs at the lows of the medium or short-term trends.
- Buy small cap growth stocks on breaks to new highs in the early stages of short-term up trends.
- Stop buying when the short-term trend is at the top of the range.
- Take partial profits when the uptrend starts to struggle at the highs.
- Never invest based on personal politics.
Disclaimer: I am not a registered investment advisor. My comments above reflect my view of the market, and what I am doing with my accounts. The analysis is not a recommendation to buy, ...
more

