
Bullish? Bearish? It's Perplexing, Says The VIX
Now that's how you bounce back from a sharp decline in the previous week. And why did markets bounce back this past trading week; markets made it so. When it was all said and done for the trading week, the S&P 500 (SPX) bounced back strongly, ending Friday up 2.79% from the previous Friday.
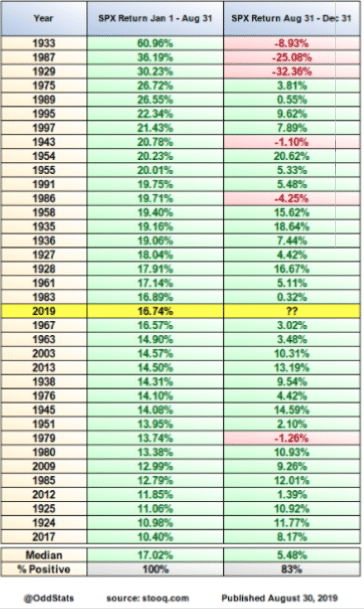
We're coming into the tail-end of the trading year and still with the S&P 500 up nearly 17%, but having a rough August for which many are glad to see it go. The only 2 years to be positive each of the first 8 months except May and August were 1967 and, of course, 2019. Here's what happened next in 1967:
![]()
Kind of mediocre if you ask us! But remember, the S&P 500 is up at least +10% YTD thru August and the sample size is worthless. So what do you think the market is likely to do in the final months of the trading year? Again, we can review history as a means of satisfying probabilities even if history doesn't necessarily have to or always repeat. (Table from OddStats)
History invites us to expect bullish outcomes for the remainder of the trading year, but history did not have 2 of the world's largest economic powers feuding and throwing tariffs back and forth for over 12 months. In being grateful that August is in the rear view mirror, let's not count our chickens...Over the past month, we’ve not only seen the worst 3 days of the year, but many 1% swings in both directions with the VIX up nearly 18% in August.
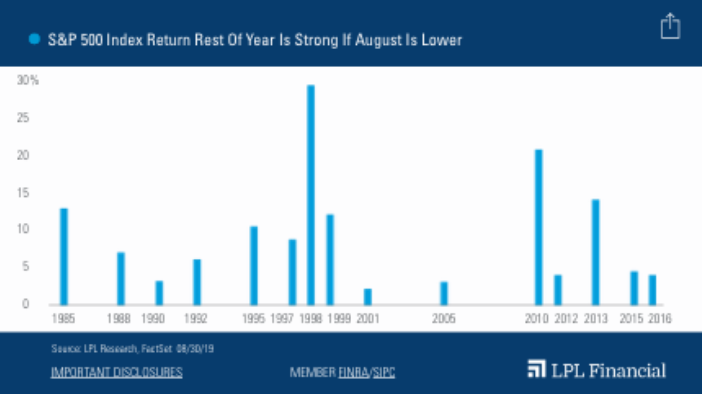
The good news is August is finally done and while the S&P 500 lost 1.81% during the month of August, September may bring better returns and a more complacent market. Not so fast! Since 1950, September has been the worst month for the S&P 500 Index, which has dropped an average about 0.5% during the month. September’s track record has been a little better recently though: Over the past 10 years, the S&P 500 has averaged a 0.9% gain in September.
“August was a burst of volatility for most investors, and we expect that to continue in September,” explained LPL Financial Senior Market Strategist Ryan Detrick. “But if you’re looking for some good news, the past 15 times stocks were lower in August, the rest of the year was actually higher every single time.”
We'll have to see if history is an accurate guide for 2019 and post the August decline, especially with the ongoing trade feud. And least we not forget the No-Deal Brexit situation that has not presented itself in the historic data. Maybe this time is one of those times we should desire this time to be different, indeed?
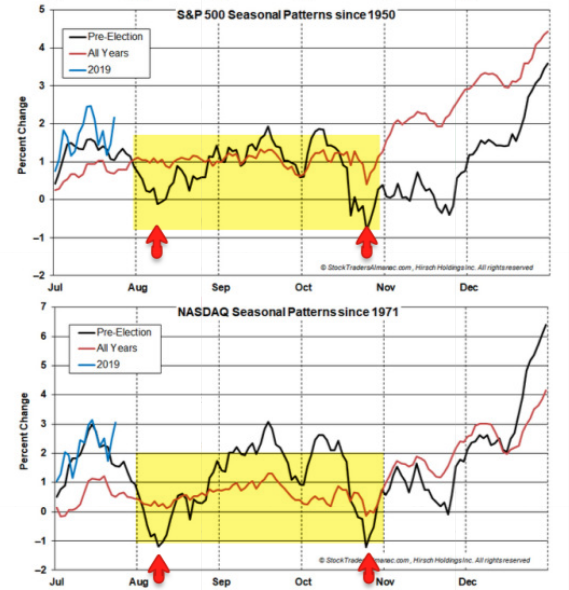
The August dump didn't have to happen, but the late July tariff escalations forced investors to reconsider their equity market exposure. Nonetheless, seasonality played its role and history proved to repeat the August dump. With that being said, if the seasonal patterns hold, there is an upward bias into mid-September for stocks, then a 2nd dump into October. The market is keeping equity investors on their toes in 2019 for sure. (From @AlmanacTrader)
In analyzing why the market performed as it did this past trading week, rising nearly 2.8% on the week, we're forced to review something I stated in last week's Research Report. Recall below:
With that being said, markets dictate policy and eventually the market will arise to the occasion once again. That may already be why the President’s tone on trade is seemingly more conciliatory than it was during Friday’s tweet storm.
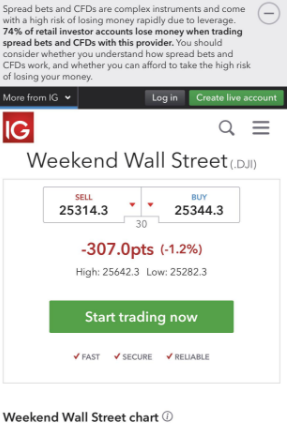
After the prior Friday tweet storm and greater than 2.4% down day in the equity markets, the Trump Administration changed its general tone on trade issues with China. Weekend Equity betting futures in London were identifying a sharp decline for this past Monday's open on Wall Street and with leaders at the G-7 Summit wrapping up a long weekend.
Once POTUS recognized the markets reaction to the trade rhetoric, it was offered that high level calls were taking place with the Chinese trade delegates and the markets quickly reversed losses and found themselves moving sharply higher. To reiterate, "markets dictate policy, always!"
While nothing actually changed for the better, with respect to geopolitical tensions, markets looked past the present escalations and toward more concrete issues. Bond yields have been plaguing investor and equity sentiment for much of the Q3 period. While much of the U.S. economic data has continued to point in favor of trend-growth (1.7%-2.5% GDP), the bond market has been suggesting something far worse is on the near-term horizon. Wether or not that "something far worse" comes to pass or not remains to be seen, but the unintended consequences from bond yields plunging as Treasury prices soar has been a boon for equities in the final trading week of August.
In this week's State of the Markets video, Finom Group (for who I am employed) outlined the need for pension funds to rebalance at the end of the month in August. The "risk free rate" is an important concept when it comes to pension funds and how they project returns and allocate capital.
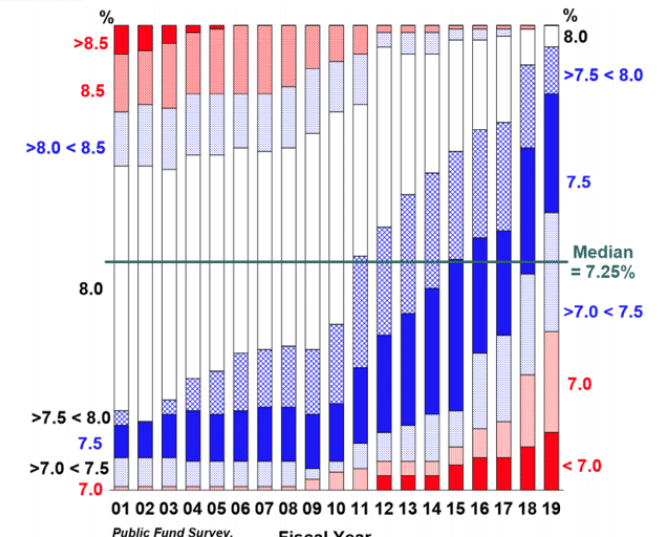
- A growing number of public pension plans are recognizing the impact of a low-rate and low-return environment, by reducing their expected return assumptions. This chart from the 2019 NASRA Public Fund Survey shows the evolution of expected return assumptions for public pension plans. In 2019, the median expected return was 7.25% across the largest public pension plans based on their diversified asset mix. This is much lower than in 2001, when most public plans had expected returns greater than 8%. The number of plans with expected returns below 7% has gone up from zero to 16 in that same time.
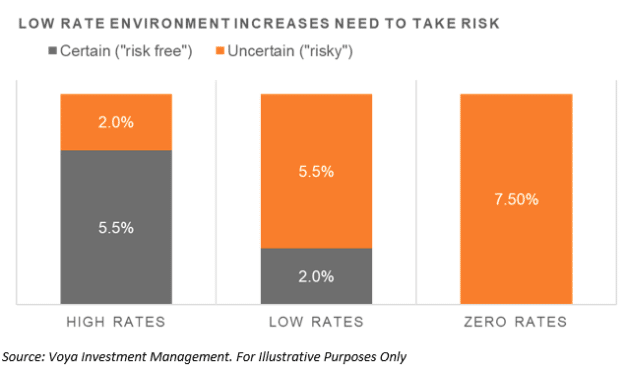
- Achieving a 7.5% return when interest rates are low to negative is riskier than achieving the same return in a higher-rate environment. For example, if risk-free interest rates are at 5.5%, then a pension plan needs to take only enough risk to generate an additional 2% in return. However, if the risk-free rate falls to 2%, then a pension plan needs to take significantly more risk in order to generate the additional 5.5%. Taken to the extreme, if interest rates were to go to zero, then the entire 7.5% would be subject to risk.
Let’s review current conditions in a “risk-free” Treasury. The benchmark 10-year Treasury current yield is a mere 1.50%, as of yesterday’s close (Aug. 30). That’s close to an all-time low, which actually occurred during the Brexit vote of 2016 at 1.32 percent. Can you do better with a broader set of assets? Perhaps, although “better” is a relative term and one that requires adjustment for risk. That sentence says it all and why we recognized billions of dollars worth of pension fund capital rotating out of bonds and into equities. In fact at present, the S&P 500 dividend yield is now higher than that of the 30-year bond. Pension funds don't have a choice. If they want to hit their projected return targets for the year, they have to move out on the risk curve i.e. allocate capital to riskier assets, like equities and/or equity ETFs. This doesn't detract from the point that bonds are extremely overbought. (See chart below)
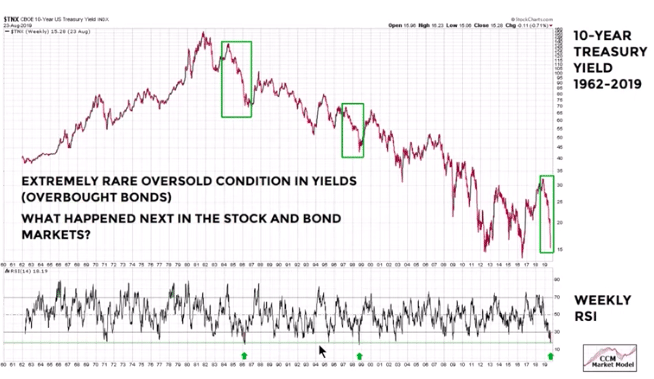
Only 3 times dating back to 1962 have we seen such oversold yield conditions on the weekly relative strength index (RSI) for the bond yields (TNX).
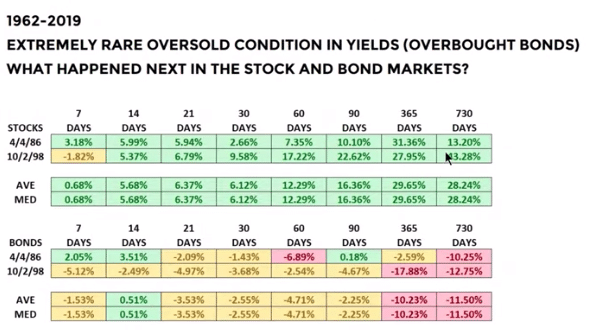
The sample size is extremely small, but that should be the expectation given the extreme oversold yield conditions we're seeing in the present and with record high bond prices. Nonetheless, in the 2 anecdotal cases presented from 1986 and 1998, bond yields rallied along with stocks across almost all time frames 2 years out.
With all that being said, some good things did happen last week even as August found negative returns. The NYSE A/D line hit a new high, breaking out of a recent channel. What is the significance you might be asking yourself?
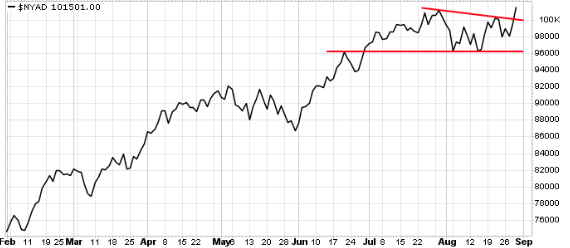
While it's true that the A-D line has often weakened before stocks have encountered a major decline, you'll need hindsight to make use of this information because you won't know it was a leading indicator until after the market weakens. For every time a weakening A-D line has signaled a major fall it has signaled nothing special at least twice as often. "Negative divergences" happen all the time. In real-time, it is impossible to know when a divergence is worth paying attention.
Last week, the cumulative advance-decline (A-D) line for both the NYSE and the S&P 500 made a new all-time high. The A-D line sums the net number of stocks moving up on the day added to yesterday's total. The idea is that when the A-D line is rising, more stocks are moving higher and breadth is considered healthy. In other words, it's a bullish sign for stocks. The not so great news is that the gains for stocks haven't always occurred right away. The S&P 500 went nowhere for several months in 2016. That was also the case in 1993 and 1996, for example. Nonetheless, the breakout to a new high in the A-D line while the S&P 500 is still below its own ATH looks bullish. But there's more, take a look at the following chart of the S&P 500 and moving averages within their respective clusters and during consolidation periods:
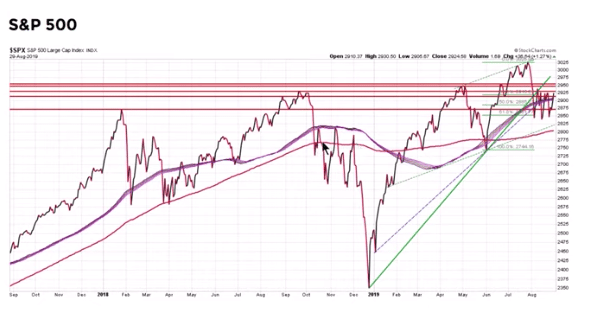
Take notice of the consolidating period right before the massive dip in December 2018. The consolidation was taking place BELOW the moving average clusters. At present, we're consolidating below, above and around the cluster of moving averages. Also in 2018, the 200-DMA was rolling over during the consolidation period, whereas presently it is curling up. By and large, the S&P 500 technicals, combined with certain breadth indicators suggest the market is technically bullish longer-term.
Keep in mind, the S&P 500 August box has continued to hold true to form with resistance at the top of the box represented at 2,940, slightly below the present 50-DMA at 2,946.
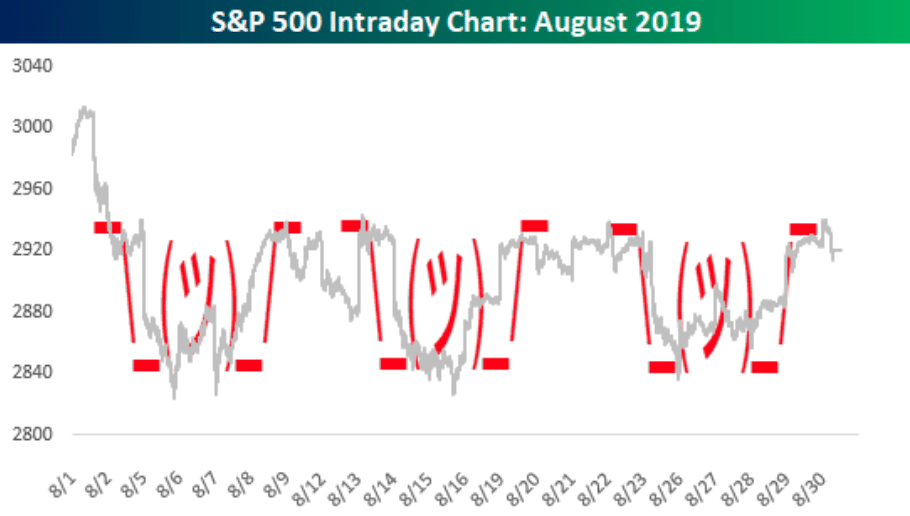
This is now the 4th time in the month of August that the S&P 500 has tested the upper bound area of the box, before being rejected. After hitting the top of the S&P 500 box on Friday, the market rolled over, giving up all of its gains intraday, before recovering, and finishing above its 100-DMA. Again, resistance held firm, but the S&P 500 managed to finish above its 100-DMA on the week. Something more definitive and that brings about investor certainty will be needed in order to break above the resistance area and hold above in September. That something may be provided by way of central bank easing during the month of September, hence a reason historically, to be optimistic about future returns. Alright, let's round out this section of the weekly Research Report, shall we and with 2 charts in 1?
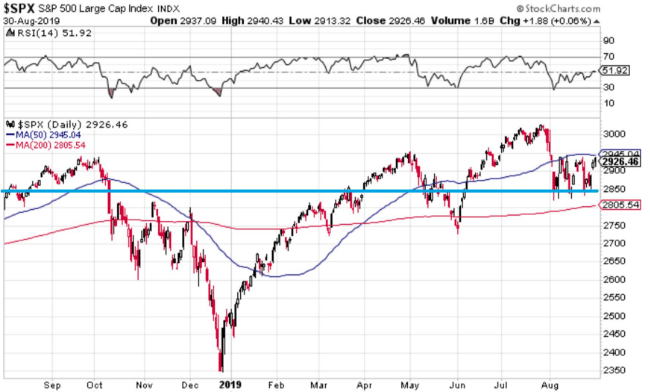
As we can recognize from the chart above, the S&P 500 has achieved an all-time high many times in 2019, but remains where it was nearly a year ago and presently below the 50-DMA. Additionally, the top box represents the S&P 500's RSI, which finished the week just above 50. That's not anywhere near representing overbought conditions nor oversold conditions. It's pretty much right in the middle of the two extreme conditions. Based on market activity and the RSI over the last year, the market can break either way but RSI indicates that a drop below RSI 40 is a buy signal while an RSI at 70 has been a sell signal.
The S&P 500 moved beyond its weekly expected move this past trading week and for the 5th time in the last 7 trading weeks. Option market has not been pricing risk well during this time period obviously. With that being said, the weekly expected move for the holiday shortened trading week to come is roughly $60/points. With the VIX falling some 5% this past week, the expected move as come down $10/points roughly.
The VIX was up nearly 18% in August, quite the volatile month and differentiating itself from the month of May where the VIX rapidly fell after the threatened Mexico tariffs were pulled back. VIX futures meandered in and out of backwardation through August as well, suggesting many volatility traders were confounded and unsure as to how to position and/or hedge the market risks.
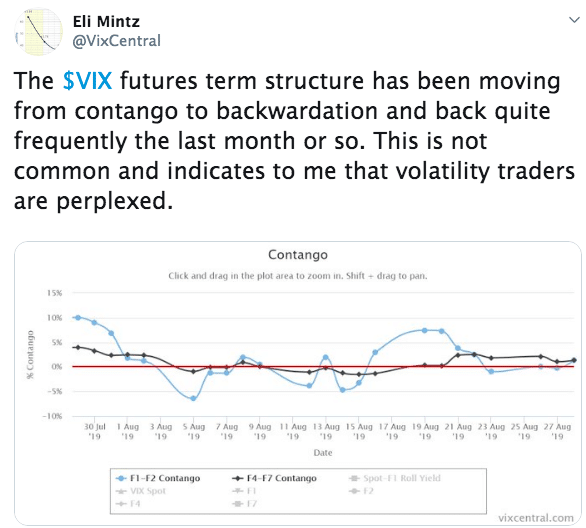
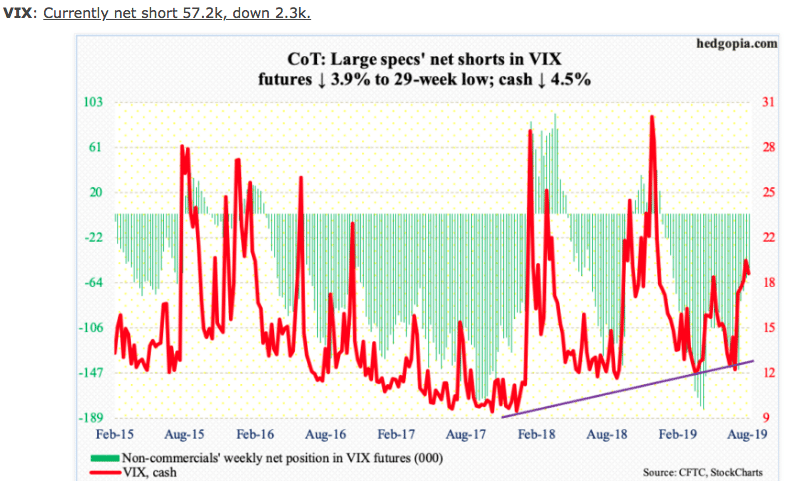
Since August 5th, when the S&P 500 tagged 2822.12, the VIX has subtly made higher lows. The VIX (18.98) peaked at 24.81 on that date and has since also made lower highs. Talk about your mixed signals, right? Nonetheless noncommercial positioning in VIX futures remains net short, but to a lesser degree as shorts have been covering in small increments (Down 2.3K contracts).
There is still nearly 10 trading days in between this coming Tuesday and the ECB meeting whereby the central bank is likely to reduce rates and outline additional stimulus measures for the Eurozone economies. This time gap doesn't lend itself to assuming an upward equity market catalyst in the coming trading week, whereby investors are likely to take their cues from economic data that has been weakening outside of the U.S. not to mention yield curve inversion paranoia.
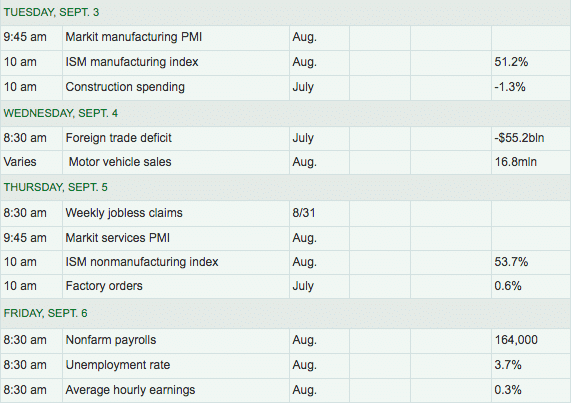
Economic Data
I'm not going to bore you tears with all the boring details concerning the weekly economic data releases for the past trading week. But... but I am going to suggest, at the very least, the comical situation that may have been presented in the two opposing results from consumer data points of the week. One showed consumers to be quite sound and optimistic and the other portrayed a sharply pessimistic and gloomy consumer.
The first chart denotes the University of Michigan's Consumer Sentiment index reading.
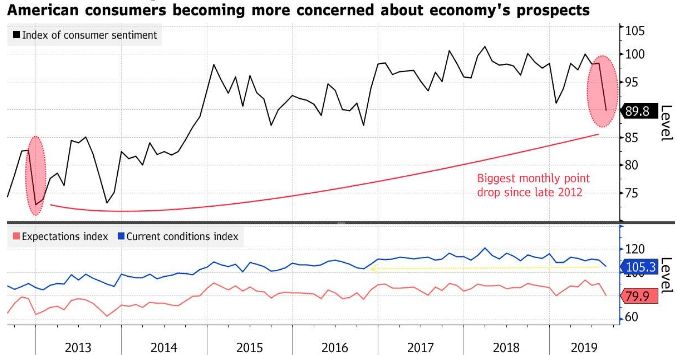
The University of Michigan Consumer Sentiment Index took a plunge Friday. The Conference Board's measure is at highs.
The Conference Board Consumer Confidence Index® declined marginally in August, following July’s rebound. The Index now stands at 135.1 (1985=100), down from 135.8 in July. The Present Situation Index – based on consumers’ assessment of current business and labor market conditions – increased from 170.9 to 177.2. The Expectations Index – based on consumers’ short-term outlook for income, business and labor market conditions – declined from 112.4 last month to 107.0 this month.
Houston, we have conflicting measures!!
- The Consumer Sentiment Index is a measurement by the University of Michigan.
- The Consumer Confidence Index (CCI) is a survey conducted by the Consumer Conference Board.
Both of the Indexes purportedly measure the same thing. Clearly one of them is very wrong. But which one is it? Now while the CSI fell the most since 2012, here's the paragraph that caught much attention within the CCI results.
"The Conference Board’s confidence measure eased in August but posted the best assessment of current conditions since 2000. Bloomberg’s weekly comfort gauge rose for a second week, while the monthly expectations saw more Americans reporting the economy’s getting worse."
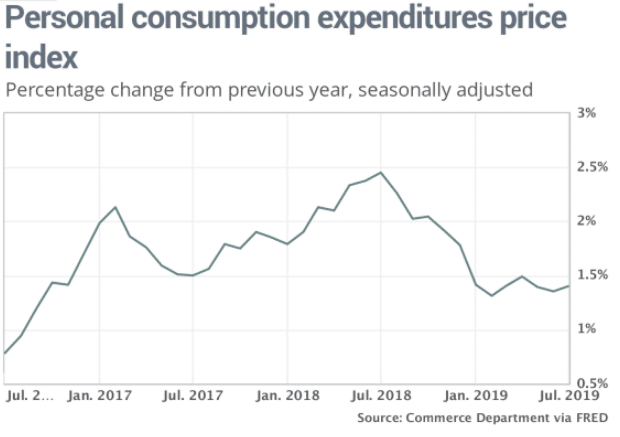
Beyond the two consumer surveys released this week, we also received government data with respect to consumer spending. Consumer spending jumped 0.6% last month, the government said Friday, matching the MarketWatch forecast.
Incomes rose just 0.1%, however, marking the smallest gain in nearly a year. Americans had to dip into their savings to cover their expenses. Inflation as measured by the Fed’s preferred PCE price index rose 0.2% in July, nudging the yearly rate up to 1.4% from 1.3%.
Speaking of low inflation, even as tariffs have been in place for over a year and are expected to rise with September 1st tariffs coming onboard, by all accounts the FOMC has ample room to cut rates at its' upcoming meeting (Sept. 18). I'm of the opinion that 25 bps is less impactful to the economy and with respect to its price stability mandate given that the Treasury yield curve is almost entirely beneath the Fed Fund Rate (FFR), even with a 25 bps cut. A 25 bps cut may not send the bond market the signal it needs to shore up yields at the front end of the curve. This may prove a risk to equity market expectations, which perceive rate cuts as providing stability to the yield curve through selling pressure of short-dated maturities. This selling pressure would, with rate cuts should serve to plunge short-dated yields below those at the long-end of the yield curve.
At present, many investors believe the economy is weakening and risks remain skewed to the downside. Thus, they are buying bonds. Barry Bannister, Stifel’s head of institutional equity strategy, says the fed funds rate is too high relative to the neutral rate, a theoretical level at which the Fed is neither restrictive nor accommodative.
“Rates signal a bear market, and Fed hesitations risk a repeat of Custer’s last stand at Little Big Horn,” Bannister wrote, referring to the 1876 battle between U.S. forces led by Gen. George Custer and several Native American tribes. “The Fed should quickly go below neutral, since crises occur at progressively lower ‘spreads’ to neutral.
In 4Q18, the Fed vastly over-shot and must quickly cut or a major bear market may result.
Even if the Fed cuts rates by another 25 basis points in September, as is widely expected, “policy would still be too tight."
Beyond the yield curve still below the FFR with another 25 bps cut, the Fed has failed to achieve its price stability mandate for some 7 years now. Additionally, the Fed has already attempted to ease financial conditions, which are already low, and its attempt did not result in righting the bond yield curve. All yields are lower than when the Fed cut rates in July 2019. Another 25 bps point cut seems an illogical measure to take with respect to past results under this analysis. If the FOMC only cuts rates by another 25 bps and that does not find the 2s/10s yield curve un-inverted and steepening, we believe this poses a headwind to risk assets. Consequently, however, it could certainly validate the hypothesis that regardless of central bank easing, the U.S. remains with a positive bond yield curve, unlike other sovereign debt markets and that has been the underlying premise for the yields plunging and not an overarching fear of economic weakness domestically.
Moreover, the longer the yield curve remains inverted and deepens the inversion, the sooner the credit markets freeze up, resulting in money flow seizing and financial conditions actually tightening. Equity markets would likely falter in this scenario. But presently, this is not what we are seeing in credit markets as shown below:
Reverting to the economic data flowing on a weekly basis, the labor market remains very strong with growing wages, low initial jobless claims and more than 7 million job openings (JOLT survey). The consumer is quite healthy as shown in the latest revision to the Q2 2019 GDP data.
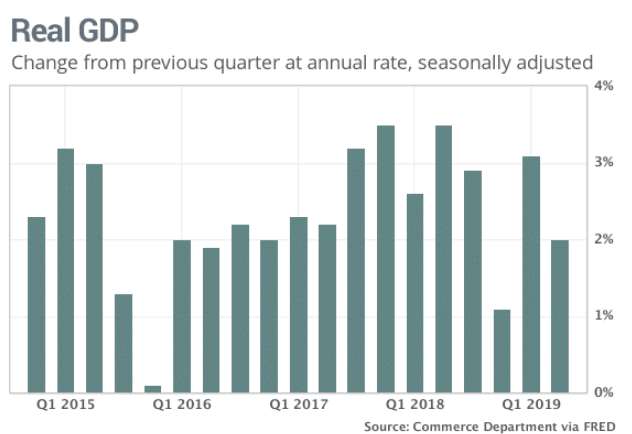
Consumer spending was even stronger in the second quarter than it first looked. The government upped its estimate to 4.7% from 4.4%, marking the biggest gain since the end of 2014. Americans spent more on new cars and trucks, clothes and eating out, among other things.
Manufacturing remains a weak point in the global and domestic economy, but the U.S. remains somewhat shielded from the impact of a manufacturing slowdown, given its consumer-based economic dependency and import reliance.
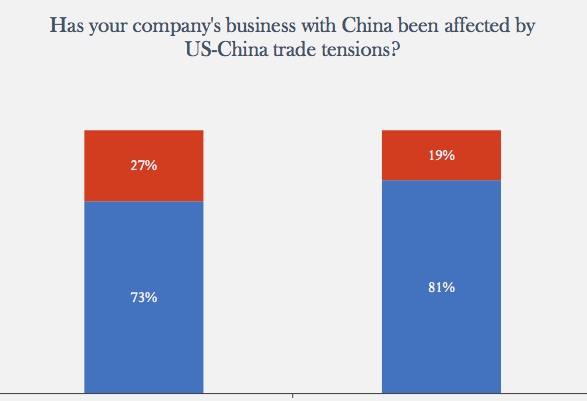
Nothing good has or is likely going to come from the trade war that continues to escalate. The recent U.S.-China Business council report and surveys suggest that despite the White House Administration's rhetoric on trade, U.S. business continue to bear the burden of the trade war and tariffs.
"The relationship between the United States and China—particularly, bilateral trade tensions—is overwhelmingly the top concern of American companies operating in China in 2019. Last year, bilateral trade tensions prompted anxiety over how punitive tariffs contribute to an unpredictable business environment. While uncertainty still pervades the 2019 data, companies report that trade tensions are having a measurable impact on US company competitiveness in the Chinese market, especially their competitiveness vis-à-vis domestic Chinese companies. Over 80 percent of American companies report that trade tensions have affected their business operations in China, an 8 percent increase from the year before."
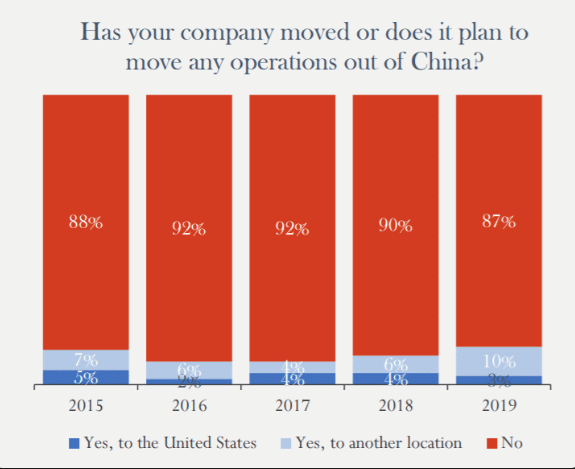
Additionally, if the White House Administrations goal, in part, was to have U.S. companies move operations out of China, it's only minimally working
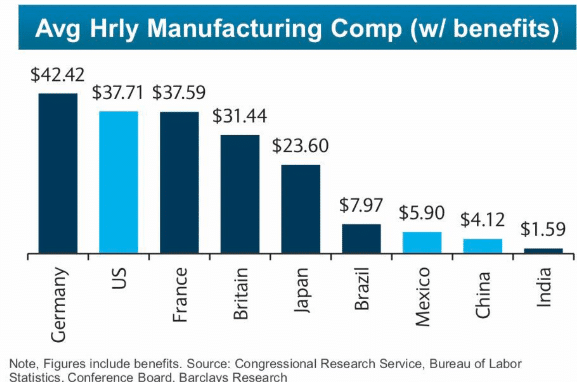
The main problem with moving away from China is not necessarily their business and/or trade practices. One could say it's not even IP theft and discrimination against foreign owned and operated entities. It's far simplier than that and something for which there is likely no remedy, WAGES! Take a look at the wage table by region below:
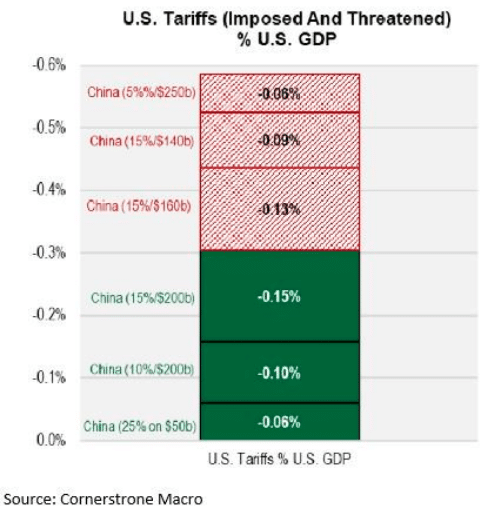
This is not a fixable issue, not through a trade war, not with tariffs and clearly not through the World Trade Organization (WTO). Nonetheless, here is how we envision the trade feud resolving into and through 2020. Additionally, the previous cumulative tariff “cost” to the U.S. economy was 0.45%, but these latest hikes coming Sunday night will lift that hit to 0.6%, according to Cornerstone Macro.
There's no present threat to removing tariffs shy of a grand deal, which appears very unlikely. I believe both countries desire IP protections so as to stimulate interest in foreign investment in China, but also to protect foreign business interests in the region. Agriculture and energy procurement is an easy win and agreeable by both parties as well. Where it gets tricky, but manageable is with respect to Huawei business within North America and the United States specifically. Having said that, minimizing restrictions further on Huawei is a bargaining tool and a need of both sides to leverage in negotiations. A truce is the most likely outcome in 2019 as trade talks resume in Washington during the month of September. I believe the negotiations will result in a deal for commodities purchases going forward in favor of reduced restrictions on Huawei. From there, a likely addition to this truce come the 4th quarter will be the announcement that no additional tariffs will be levied in 2019, including the already threatened December tariffs.
The aforementioned truce and negotiated actions set the stage for a potential removal of certain tariffs and IP protection measures in 2020, during the U.S. Presidential election cycle. What we can't be certain of is when or if the market dictates to the contrary of what we've analyzed and modeled. If the market dictates more consequentially/negatively, we would have to believe the "Trump Put" would be put to the test again and find a repeated conciliatory tone and potential actions on trade more near-term.
Fund Flows
The latest fund flow data, which is a week behind the past trading week continues to identify flows into bonds and out of equities. According to Lipper Weekly FundFlow data, ETFs had overall positive net flows of $2.4 billion which were attributable to the taxable bond (+$4.4 billion) and muni bond (+$291 million) asset groups. Among the fixed income ETF universe the largest individual net inflows belonged to the Schwab U.S. TIPS ETF (SCHP, +$969 million), iShares U.S. Treasury Bond ETF (GOVT, +$680 million), and iShares National Municipal Bond ETF (MUB, +$172 million).
Conversely, equity ETFs (-$2.3 billion) saw money leave their coffers with the Industrial Select Sector SPDR ETF (XLI, -$823 million) and iShares Core S&P 500 ETF (IVV, -$810 million) suffering the largest net outflows.
Equity mutual funds (-$5.0 billion) experienced net outflows for the twenty-eighth straight week. Both domestic equity funds (-$3.1 billion) and non-domestic equity funds (-$1.9 billion) contributed to this week’s net negative flows. The largest net outflows among the equity peer groups belonged to Emerging Markets Funds (-$487 million) and Large-Cap Core Funds (-$416 million).
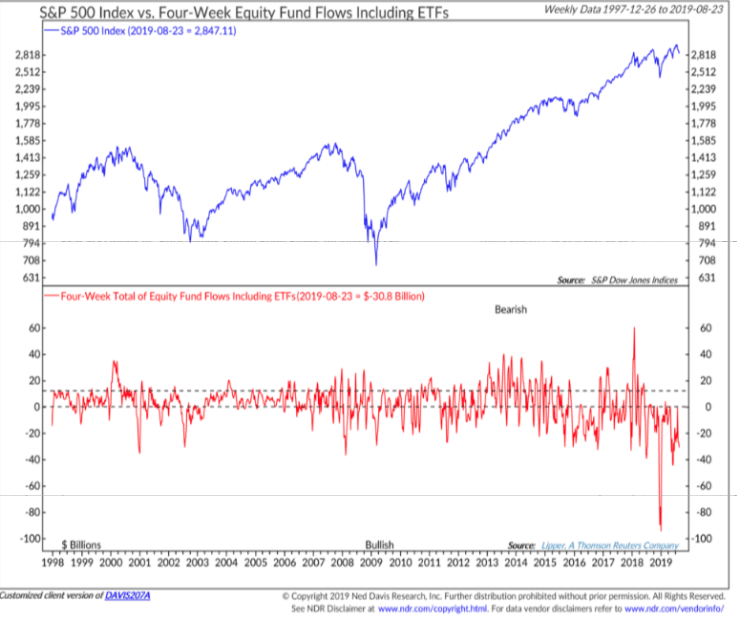
There has been $41.6b worth of outflows from equity MF and ETFs in August, including -$19.5b in the past 2 weeks alone (Lipper). Despite net outflows in equities since 2017, the chart below from Ned Davis Research identifies the rise in equities juxtaposed with net outflows (bottom box)
The ICI weekly fund flow report isn't any better either. ICI weekly fund flows (combined ETFs & MFs) for U.S. equities: -$9.4B, month to date -$25.8B, which is almost the same amount for last month -$26B (July prel). Bringing the YTD to -$115.7B, which is already above the 2018 total year -$111.8B.
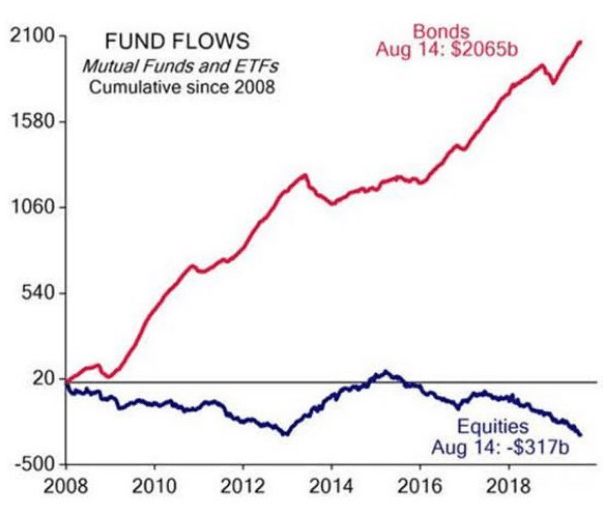
The chart below more easily represents the vast disparity between bonds and equities since the Great Financial Crisis.
It's not just that the equity outflows have been persistent, it's that the market is more highly favoring passive investment vehicles and shunning hedge fund alignment and active capital management. It's a dangerous concoction for markets that rely heavily on liquidity, and when passive investment vehicles and outflows exist in the same paradigm, market moves can be exacerbated in either direction.
Investors’ frustration with hedge funds continues to mount in 2019, driving down management and performance fees to well below the “two and 20” fee model once considered standard, according to Eurekahedge. More hedge funds have shut than started in each of the last three years, and those that do launch are far smaller than they were before the financial crisis.
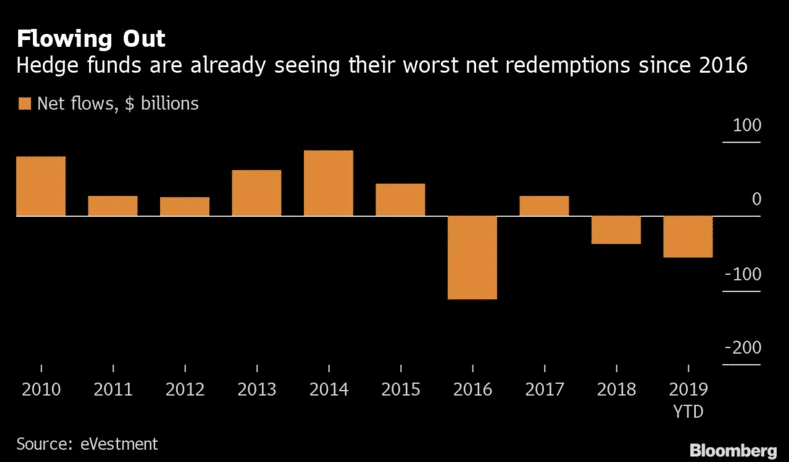
Long/short equity funds are having the hardest time, with net outflows this year of $25.5 billion, according to the report.
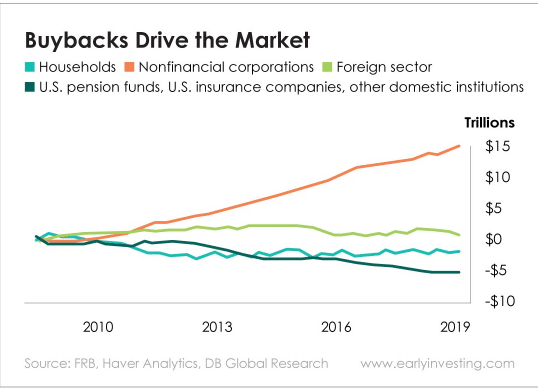
As I always consider the facts, even with net outflows and hedge fund redemptions trumping last year's total already, somebody or some entity is buying the market. Who has been buying market since 2009? The companies themselves. Take a look at the chart below. The orange line shows net purchases of stock (buybacks) by U.S. companies. The light blue line shows households, which, as you can see, have been net sellers of U.S. stocks. Same for U.S. pension funds and other institutions (teal line). Foreign buyers (lime green line) have contributed to the market’s rise, but as you can see, they make up only a small fraction of buybacks.
Buyback activity slowed in the Q2 period. This headline, “Slowing Share Buybacks Remove a Pillar of Stock Market,” in The Wall Street Journal caught my eye last week, as did this part of the story:
"U.S. corporations are repurchasing their own shares at the slowest pace in 18 months, a potential sign of more volatility as the buyback bonanza from the corporate-tax overhaul wanes.
Companies in the S&P 500 repurchased about $166 billion of their own stock in the second quarter, S&P Dow Jones Indices projects, down from $205.8 billion in the first quarter and $190.6 billion in the same period a year ago. That marks the lowest total since the fourth quarter of 2017 and the second consecutive quarter of contraction."
I'm not so sure this is a lasting trend, contracting buybacks. It may actually prove more strategic as the trade war weighs heavily on CFO's and CEO's decisions to allocate quarterly cash flow to buybacks, not knowing what the next phase of the trade war looks like. It actually seems foolish to think buybacks will contract meaningfully given the low interest rate environment that persists also lends itself to borrowing. While debt driven buybacks remain quite low, when compared to cash flow driven buyback programs, the impetus is always their to raise debt to increase buybacks should a company believe it is advantaged to do so. Don't get me wrong, it's not the politically correct thing to do, but shareholder returns are top of mind within the C-suite!
Earnings Outlook
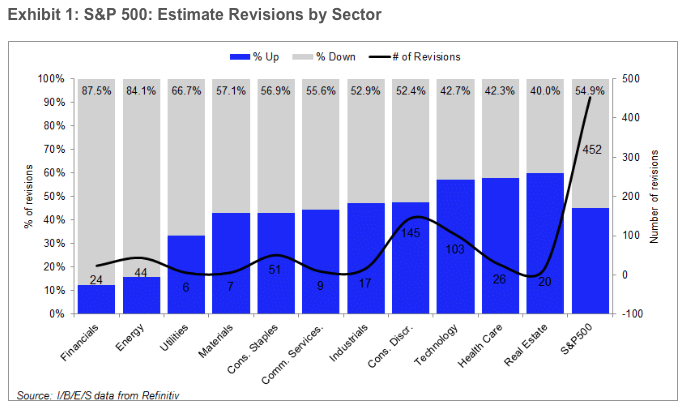
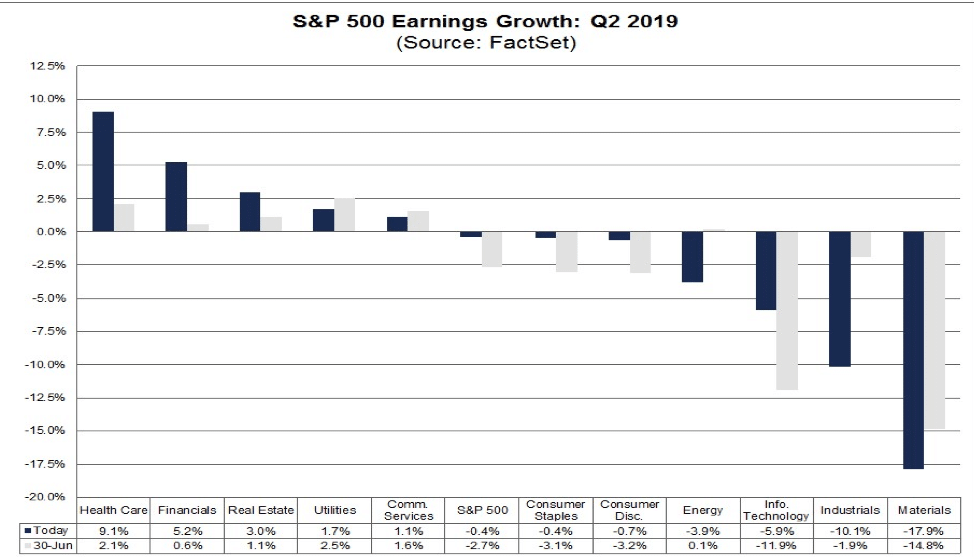
It depends on who you ask right, did earnings grow in Q2 or not and by how much. FactSet suggests that for Q2 2019, the blended earnings decline for the S&P 500 is -0.4 percent. But in contrast to FactSet results, Refinitiv suggests the following:
Aggregate Estimates and Revisions
- Second quarter earnings are expected to increase 3.2% from 18Q2. Excluding the energy sector, the earnings growth estimate is 3.9%.
- Of the 496 companies in the S&P 500 that have reported earnings to date for 19Q2, 73.8% have reported earnings above analyst expectations. This compares to a long-term average of 65% and prior four quarter average of 76%.
- 19Q2 revenue is expected to increase 4.6% from 18Q2. Excluding the energy sector, the growth estimate is 5.1%.
- 56.5% of companies have reported 19Q2 revenue above analyst expectations. This compares to a long-term average of 60% and an average over the past four quarters of 63%.
- The forward four-quarter (19Q3 –20Q2) P/E ratio for the S&P 500 is 17.0.
- During the week of August. 30, one S&P 500 company is expected to report quarterly earnings.
So what gives right? FactSet says earnings recession while Refinitiv says YoY EPS growth. The discrepancies between different data providers underscore that earnings-per-share metrics can be subjective. John Butters, senior earnings analyst at FactSet, says that the differences can likely be attributed to whether the data provider uses GAAP or non-GAAP earnings numbers to estimate growth, how they estimate number of shares outstanding and how the provider accounts for differences in the makeup of the S&P 500 from year to year.
“Probably the biggest difference is going to be at the company level and what is included or excluded from earnings,” says David Aurelio, senior manager of equity markets research at Refinitiv.
For example, in 2018 Google parent Alphabet Inc. was hit with a $5 billion fine by the European Union. Refinitiv included this in its estimate of earnings last year, which makes this year’s earnings look better by comparison. Had it excluded that charge, Aurelio said, S&P 500 earnings per share would be on pace for 1.7% growth in the second quarter, rather than the 3.2% growth he estimates today.
Kristina Hooper, chief global market strategist at Invesco says that while an earnings recession, or a period of very low earnings growth, can signal important information about the health of the corporate sector, investors should not overestimate the phenomenon as a predictor of future performance. “Earnings recessions are a lagging indicator. When we discuss an earnings recession, we’re looking in the rearview mirror.”
"What’s far more important is where we expect earnings to go, and that’s an even more inexact process” than estimating EPS growth during past quarters. It’s more difficult in today’s environment, when corporate performance is so heavily dependent on the outcome of the U.S.-China trade battle."
Going forward with additional tariffs and a weakening global economy, the forecast for Q3 earnings growth has not improved, but worsened according to both Refinitiv and FactSet. The estimated earnings growth rate for the S&P 500 for 19Q3 is -2.0%, according to Refinitiv. If the energy sector is excluded, the growth rate improves to -0.3 percent. Keep in mind that just this past week Russia declined to cut oil production, which sent crude oil prices plunging some 3% on the Friday. Regardless, FactSet also sees Q3 earnings falling YoY. For the second half of 2019, analysts see a decline in earnings in the third quarter and low-single-digit growth in earnings in the fourth quarter.
- For Q3 2019, analysts are projecting a decline in earnings of -3.5% and revenue growth of 3.1%.
- For Q4 2019, analysts are projecting earnings growth of 3.5% and revenue growth of 4.0%.
- For CY 2019, analysts are projecting earnings growth of 1.5% and revenue growth of 4.4%.
- For Q1 2020, analysts are projecting earnings growth of 8.2% and revenue growth of 5.7%.
- For Q2 2020, analysts are projecting earnings growth of 9.3% and revenue growth of 6.5%.
Investor Takeaways
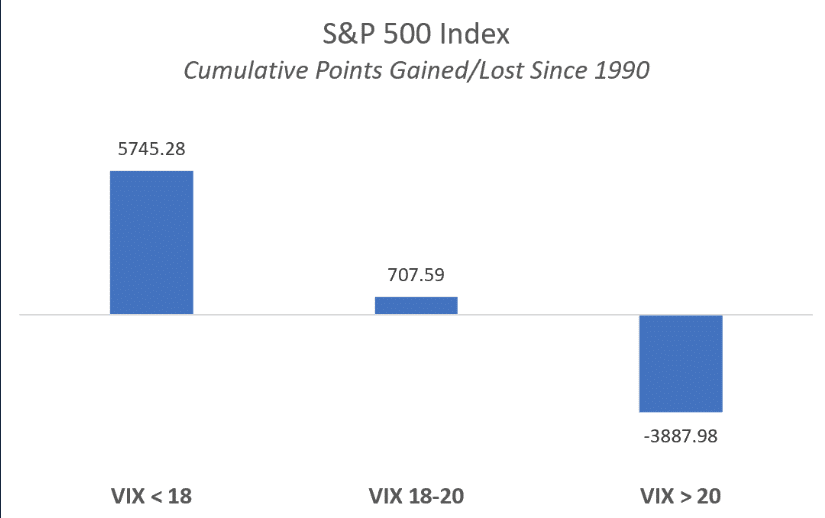
While we'd like to suggest the big picture takeaway is one with optimism and macro-related for the coming week, it may be something as simple as looking at the VIX that guides our trading in the week ahead. While the S&P 500 rallied sharply in the past trading week, with a flush of capital from pension funds providing the boost, the VIX only fell about 4.5% for the week. It suggests very much that the vast majority of market participants are perplexed about the rally and the go-forward prospects for returns.
The VIX will begin the trading week above 18, which is elevated on the year and found to be neutral for equity returns historically. Take a look at the chart below, which identifies point gains or lost based on the 18-level and since the inception of the VIX.
Furthermore, while the NYSE A/D line did indeed hit a new high in the past trading week, we can not rely on additional S&P 500 gains immediately. As we have seen in previous years, gains are likely, but not always immediate.
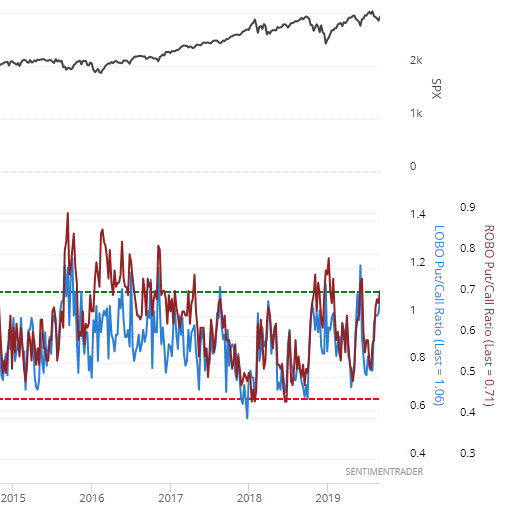
In combination with other metrics and indicators noted within, the put/call ratio suggests fear remains with market participants and despite a more amicable tone to trade headlines. This is in fitting with the minor decline seen in the VIX recently, suggesting the rally in the past week was not without put buying activity and fear for another leg lower in the market.
I have mentioned numerous times over the last 2 weeks that the S&P 500 box has been presented in a similar fashion, technically speaking, as it had been in Q4 2018.
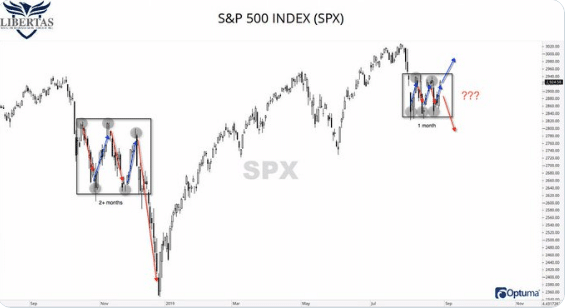
Last, but certainly not least is another breadth indication for investors to consider, the bullish percent above and/or below their respective moving averages.
Nonetheless, I am more optimistic about the current S&P 500 box given the consolidation is occurring with an upward sloping moving average cluster. Additionally, it is occurring with more favorable support from dovish central banks, lower rates/yields and an already achieved technical bear market, suggesting another bear market is unlikely so quickly after the previous one.
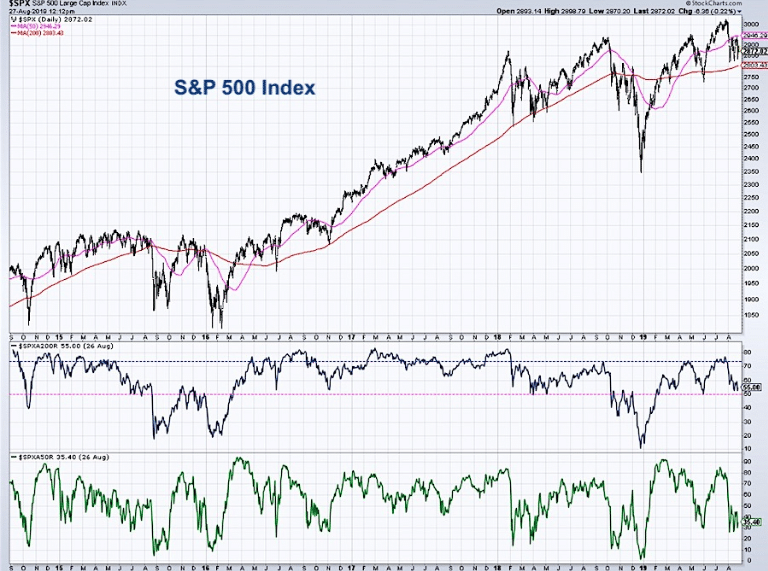
The number of stocks trading above their 50-DMA is indicated by the bottom series on the chart. You’ll see that when the market was moving to new highs in July, this indicator peaked at around 85 percent. In the last month, only 35% of S&P 500 stocks are above their 50-DMA. This is not what I desire to see. However,...
The percent of stocks above their 200-day moving average (middle box of chart) is more favorable and above 50% presently. This breadth measure peaked around 75% in mid-July and has since corrected to around 55 percent. The pink horizontal line indicates the key 50% level for this indicator. As long as over 50% of S&P stocks remain above their 200-day moving average, for example in May 2019 and April 2018, the market has continued on to higher highs. In the cases where this indicator has broken below 50%, in October 2018 and August 2015, the market has faltered.
As previously stated, more rhetoric on the “trade front” sent stocks surging back to resistance last week, only to fail at the 50-DMA. While the week posted a gain, the market still remains range-bound. A break above the 50-DMA would allow for a push back to all-time highs. A break to the downside would probably retest lower levels more quickly, given the lack of market liquidity.
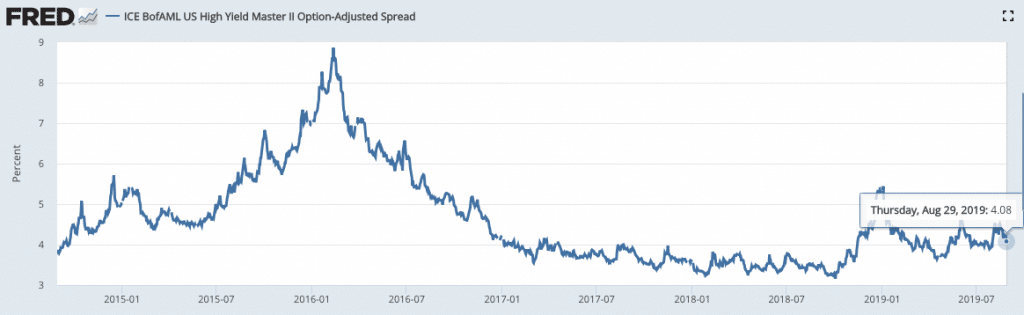
Downside risk is moderate, but elevating based on many indicators noted. If we begin to break support, I might suggest reducing risk further and giving focus toward a shopping list of stocks created over the month of August. The focus is always with regards to the equity markets and their ebbs and flows, but consolidation periods with the yield curve inverting beg of investors to also pay attention to the high-yield market.
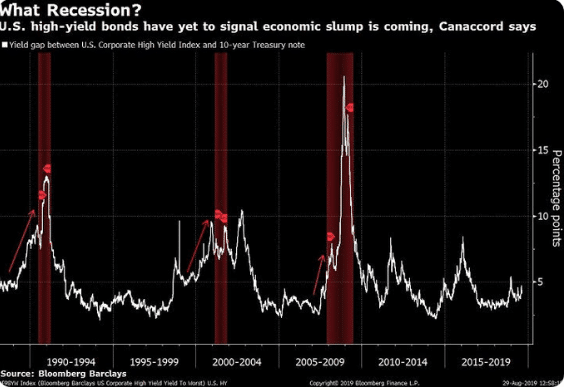
Throughout the August consolidation period, the high-yield market hasn't painted the same recession headline risk associated with the media articulations and characterizations. It doesn't mean the picture can't change in September; it just means there is one more variable to consider in the final month of the quarter, at least.


