
Bull Run Continues On Tax Cut Hopes
Let’s pick up where we left off last week:
“The short-term analysis of the market remains broadly positive with both the ongoing bullish trend and recent break above 2500 remaining intact through the close on Friday. As I noted last weekend:
As shown below, the market is pushing a short-term ‘buy’ signal. However, now at 2-standard deviations above the 75-dma, as seen previously, the market likely has limited upside from here.”
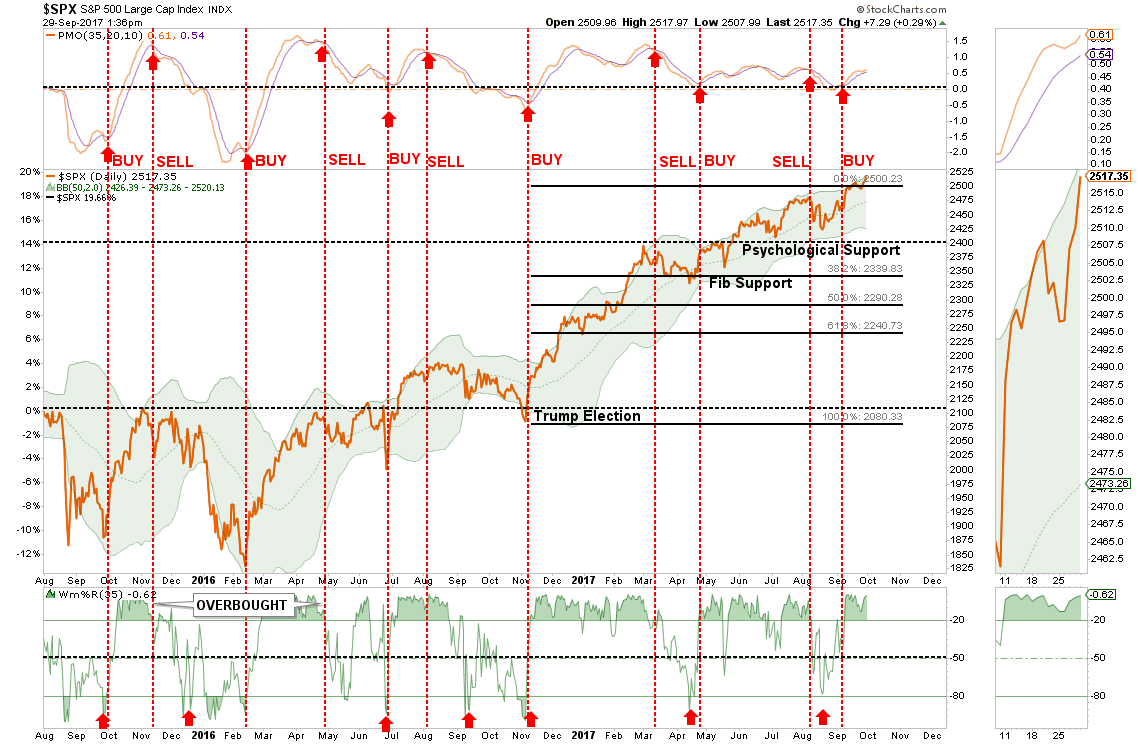
The breakout, of course, was driven by continued hopes of tax cuts/reforms from the White House as details of the latest proposal from the House Ways and Means Committee were released this week. (Click Here For Details & Analysis)
While the recent breakout is a continuation of the “hopes” f or legislative agenda to boost economic growth, there has actually been very little accomplished on that front. Nonetheless, with over $2 Trillion in Central Bank interventions flowing into the markets since the beginning of the year it is not surprising stocks have remained in a strong bullish trend.

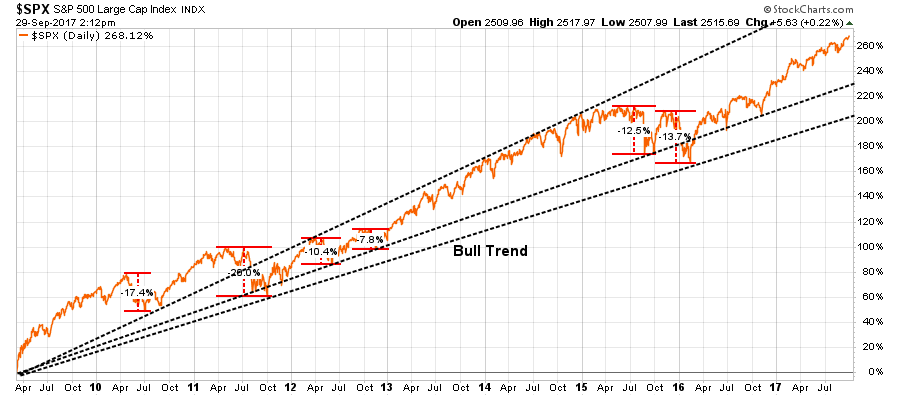
More importantly, since the March 9th lows, the bull market has surged more than 268% with no decline greater than 20% along the way. Importantly, the correction in early 2016, did not violate the trend line from the 2011 lows which keeps the current market defined to a singular bull market.
This bullish backdrop keeps portfolios allocated towards equity risks currently. With the breakout above 2500, we have:
- Increased equity allocations in new accounts that were underweight.
- Added bond exposure on the push higher in rates which suppressed bond prices in the short-term.
- Shifted cash management accounts into the cash allocation strategy increasing yield to 2.0%
Overall, models remain fully allocated toward equities as there has been NO indication currently the bull market has come to an end.
However, don’t mistake the current bullish stance as a long-term position.
Investing simply doesn’t work that way.
The Real Problem Of Buy & Hold
Currently, there are a plethora of articles being written suggesting that since “you can’t beat the market,” you should simply just buy low-cost indexes and hold on.
This strategy will work at increasing your net worth over a long enough time frame.
However, you will FAIL at reaching your retirement goals.
Let me show you the math.
Let’s set up a quick example to prove the point.
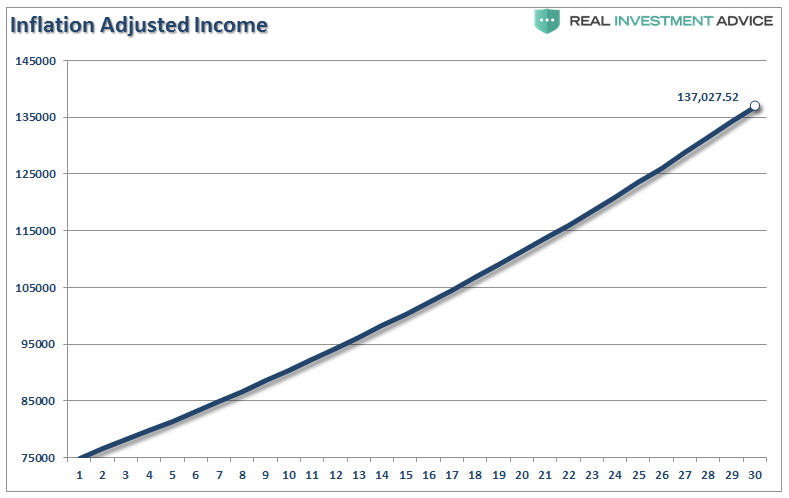
Bob is 35-years old, earns $75,000 a year, saves 10% of his gross salary each year and wants to have the same income in retirement that he currently has today. In our forecast, we will assume the market returns 7% each year and we will use 2.1% for inflation (long-term median) for planning purposes.
In 30 years, Bob’s equivalent income requirement will roughly be $137,000 annually.
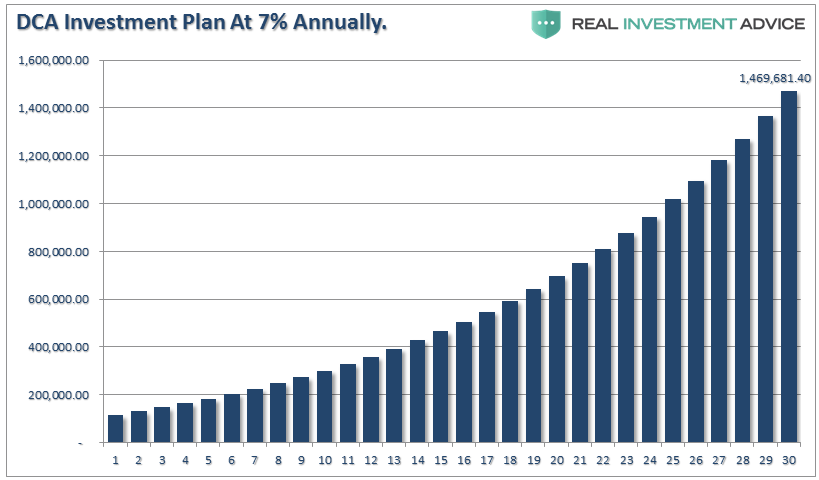
So, starting with a $100,000 investment, he gets committed to saving $7500 (10% of his salary) each year into his index fund and sits back to watch it compound at 7% annually into a whopping $1.46 million nest egg at retirement.
See, absolutely nothing to worry about. Right?
Not so fast.
PROBLEM #1
Given the economic drag of the 3-D’s (Debt, Demographics & Deflation) currently in progress, which will span the next 30-years, long-term interest rates will remain low. Therefore, if we assume that a portfolio can deliver an income of 3% annually, the assets required by Bob to fulfill his retirement needs will be roughly $4.6 Million.
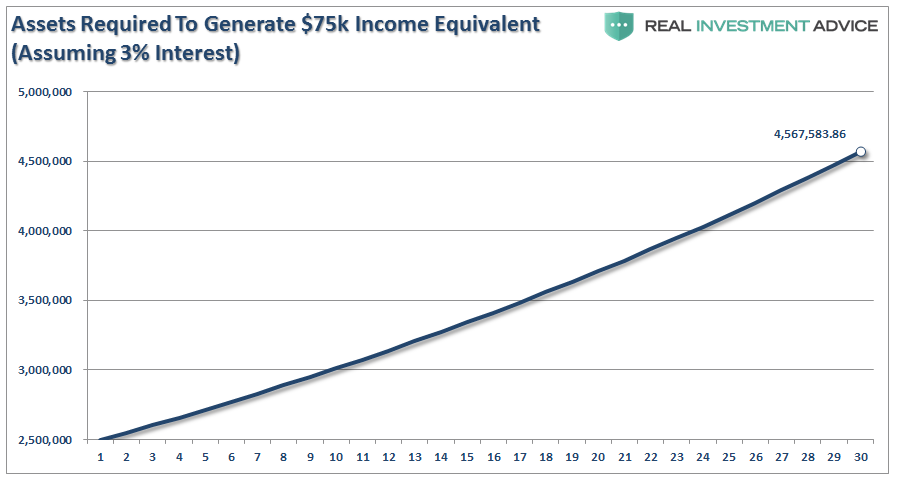
(Yes, I have excluded social security, pensions, etc. – this is for illustrative purposes only.)
The roughly $3-million shortfall will force Bob to reconsider his income requirements for retirement.
PROBLEM #2
MARKETS DON’T COMPOUND. The chart below is a $100,000 investment plus $7500 per year compounding at 7% annually versus variable rate returns. I have taken historical returns from 2009 to present (giving Bob the benefit of front-loaded returns at the start of his journey) and then projected forward using a normal standard deviation for market returns.
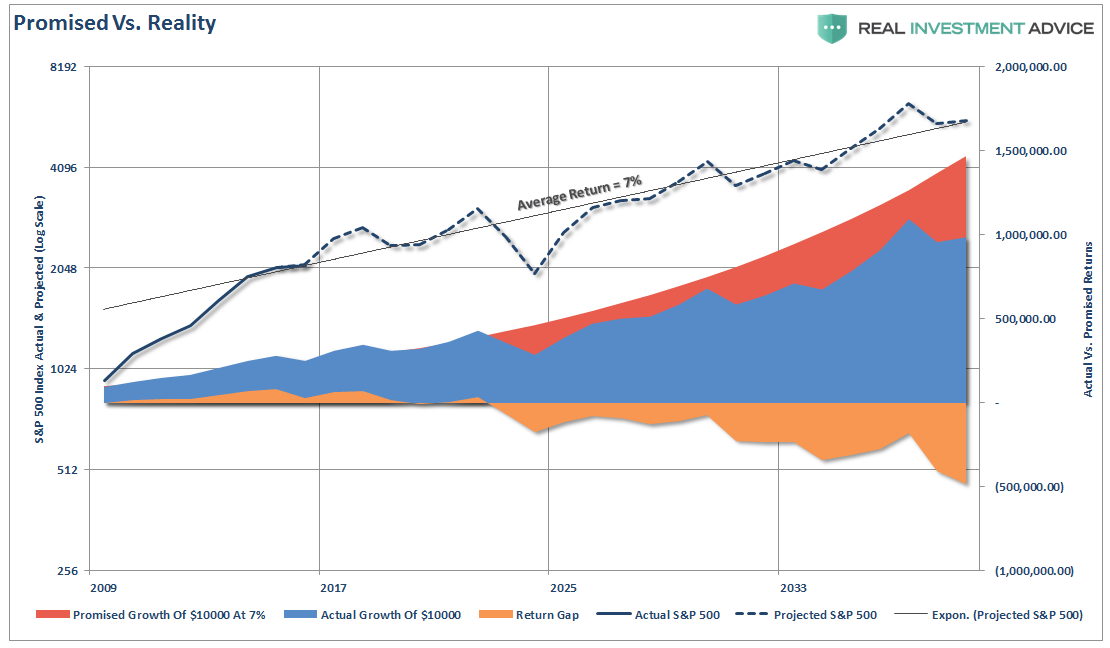
The important point is to denote the shortfall between what is “promised to happen” versus what “really happens” to your money when crashes occur. The “sequence of returns” is critical to the long-term success of your investment outcomes.
Bob’s $1.5 million projected retirement goal, (suggested by 7% annual compounding) comes up short by $500k.
Importantly, that is FAR SHORT of the $4.6 million needed to create an inflation-adjusted income stream at retirement as shown above.
This is why “buy and hold” and “dollar cost averaging” is a complete myth.
The math doesn’t lie.
You CAN NOT suffer major draw downs of capital during your investment time horizon. However, YOU CAN introduce a small method of risk management to preserve capital during draw down periods which will significantly increase returns over time.
No, you don’t have to sell the exact top. Nor do you need to buy the exact bottom. In fact, you will miss both.
The chart below uses a well-known growth stock mutual fund and intermediate bond fund. The management method is simple:
- When the S&P index is above the 12-month moving average, you are 100% invested in the growth mutual fund.
- When the S&P index is below the 12-month moving average you are 100% invested in the bond mutual fund.
The blue line is the risk managed version and the red is assuming an investor just “buy and holds” and “dollar cost averages” into the growth stock mutual fund.

For Bob, the difference is between meeting his retirement goals or not.
Over the next 10-years, given where current valuation levels reside, forward returns are going to be substantially lower than they have been over the last 10-years. This doesn’t mean there won’t be some “rippin’” bull markets during that time, there will also be some corrections along the way.
Just remember:
“Getting Back To Even Does Not Equal Making Money.”
Bull Market In Complacency
With the understanding that we are currently invested in the markets AND that we apply risk management to our portfolio strategies, let me just say this:
“At some point in the not-so-distant-future, a day of reckoning is coming. The next bear market cycle, when it occurs, will be as devastating as the last two as valuations once again revert beyond the mean.”
The timing, and trigger, of that event are unknown.
I wish I could tell you it was going to be June 22, 2019.
But I can’t. Nor will I try.
However, I can tell you it’s coming.
The chart below shows the market on a monthly basis. Each time historically that markets began to push 3-standard deviations of the long-term mean corrections were often nearby. The difference between a correction within an uptrend, and a full-fledged bear market, were closely coupled to excessive levels of valuation and a high-level of investor complacency.
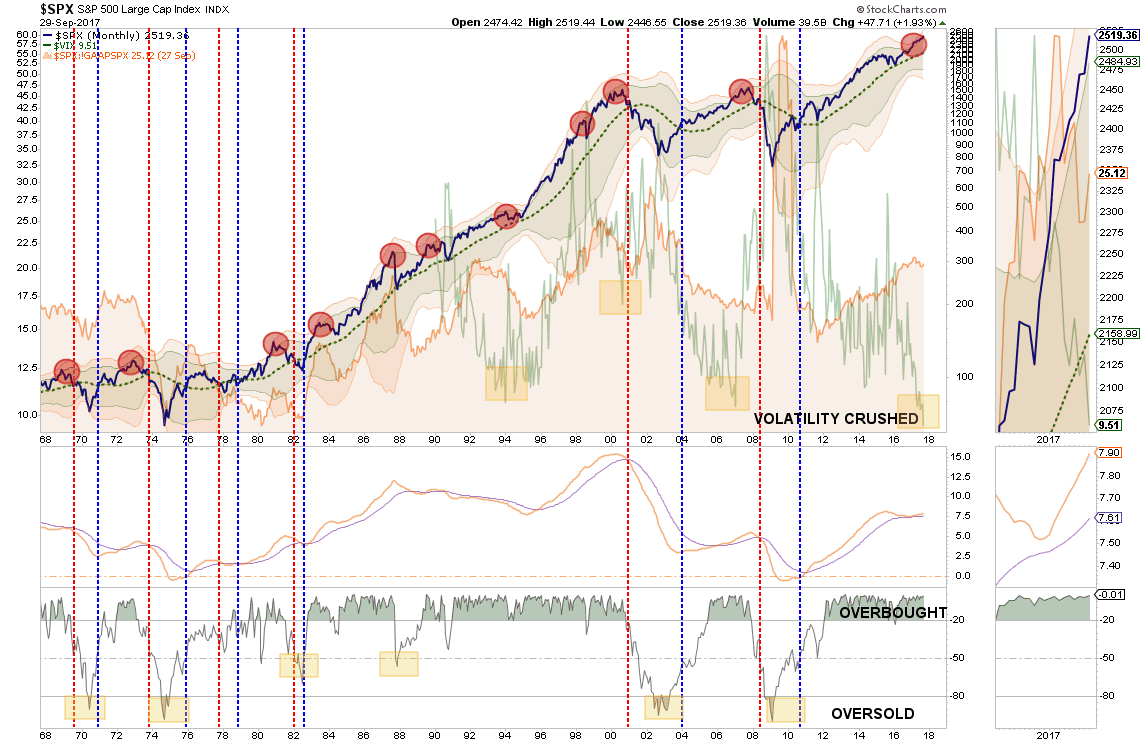
At nearly 30x earnings – the key ingredients of valuation, excessive deviation, and extreme complacency are present.
As Doug Kass penned last week:
“At this time 85 years ago, Yale economist Irving Fisher was jubilant. ‘Stock prices have reached what looks like a permanently high plateau,’ he rejoiced in the pages of the New York Times. That dry pronunciation would go on to be one of his most frequently quoted predictions — but only because history would record his declaration as one of the wrongest market readings of all time. ” – Time Magazine, The Worst Tip in History
The Fast Money panelists are giving a host of reasons for the near-epic lack of market drawdown in 2017. Respectfully, I will repeat my reasons — which differ from the general views that progress of the domestic economy and corporate profits are great, an orderly rotation is occurring, that there is hope for regulatory and tax reform, etc.
From my perch, stocks continue to be buoyed by some of the following conditions:
* Massive injections of liquidity from the world’s central bankers
* Passive investing (quants and ETFs) are now dominating markets (at nearly 40%) — at the margin (There are now also more ETF’s than
* Machines and algos — as well as many individual investors — are behaving differently as they are now programmed and conditioned to buy the dips
* 17% of the listed shares outstanding have been retired in corporate stock repurchases since the Generational Low in March, 2009.
* More than half of the listed companies on the exchanges have disappeared over the last eight years
We have a “Bull Market in Complacency”
Market & Sector Analysis
Data Analysis Of The Market & Sectors For Traders
S&P 500 Tear Sheet

Performance Analysis
ETF Model Relative Performance Analysis

Sector & Market Analysis:
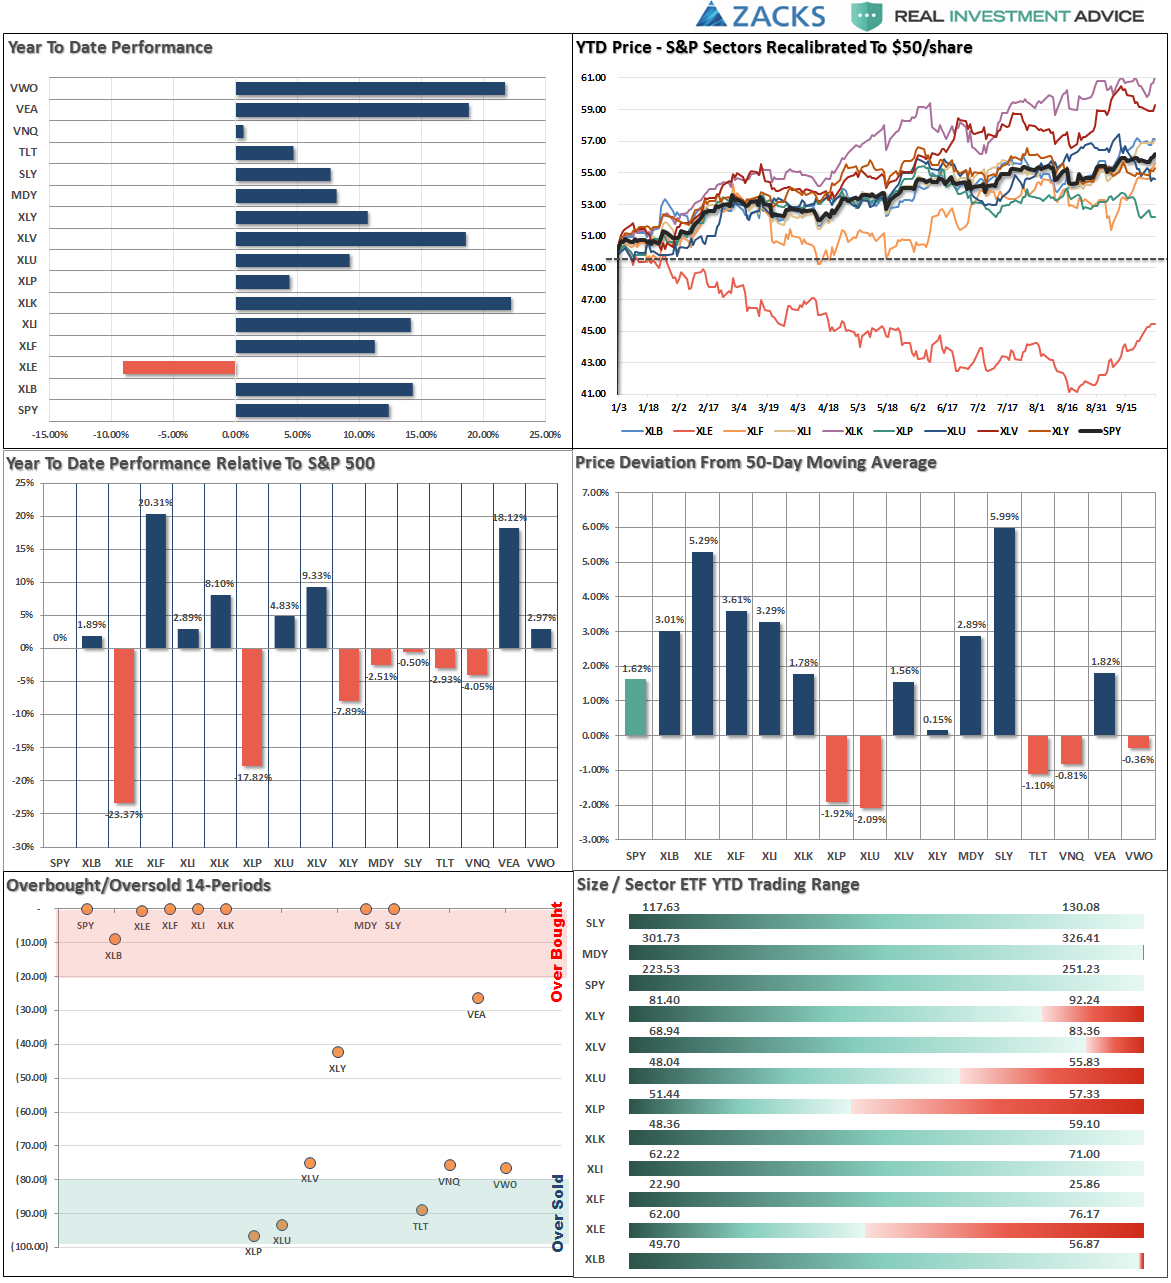
One of the biggest problems for investors over the last 19 weeks has been the very rapid rotation between sectors and indices as money continues to chase performance. The high correlation between all sectors and markets is problematic when the next downturn begins as there will be relatively no “safe place” to hide.

Let’s take a look at the sector breakdown.
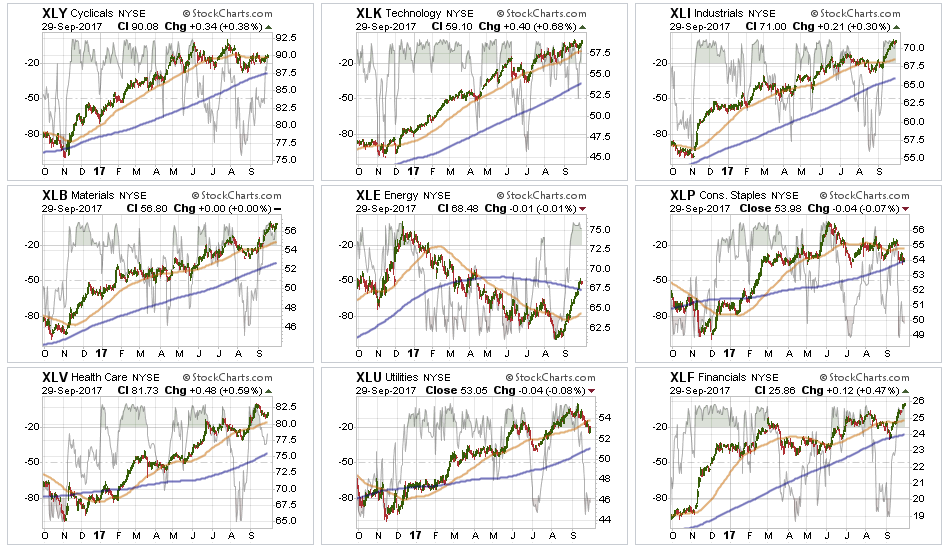
Technology, Health Care, Industrials, Materials, and Financials – continued to lead this past week. With these sectors now back to very overbought levels in the short-term, some profit taking is advised. The big advance in Industrials and Materials is the revival of the “Trump Trade” on hopes of tax reform and infrastructure spending. Both of these areas are at risk of disappointment from D.C. – take some money off the table.
Energy, as noted over the last three weeks, has mustered a decent bounce but the trends and backdrop remain sorely negative. The pop in oil prices to $52/share is likely largely done as the underlying fundamentals for the sector remain weak. While the underlying technicals are beginning to improve, bounces in the sector should still be used to reduce weak and underperforming positions. We continue to remain out of the sector entirely currently, but if the recent improvement can reverse the negative trends we will add weight to portfolios.
Discretionary and Staples have been under pressure as the consumer weakness continues to spread through the underlying companies. That story is a macroeconomic story that is being ignored by the rest of the market currently, however, it will eventually be the “tail that wags to dog.”
Utilities are once again VERY oversold but the pop in interest rates following the announcement of the Trump Tax Plan led to a violation of the 50-dma.Stops should be moved up to $51 and any violation of the 200-dma should be watched closely.
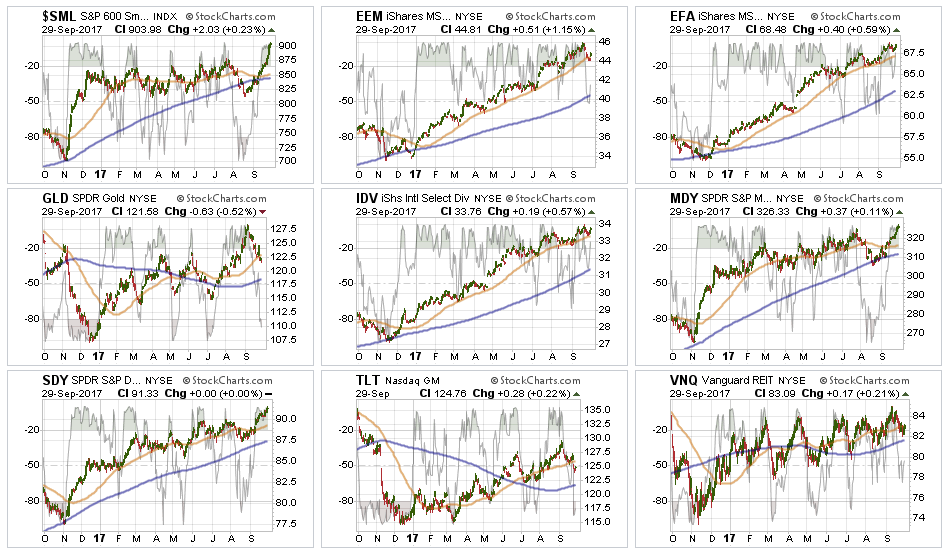
Small and Mid-Cap stocks continued their relative rotation pick up from last week. With both indices back to extreme overbought levels, stops should be moved up accordingly. The moves to new highs for both markets provides some impetus for the market’s push higher in the short-term.
Emerging Markets and International Stocks continue to hold support and money has been chasing performance in these sectors as of late. The recent calls to take profits in these sectors continues to remain prudent.
Gold – as feared, Gold has begun to reverse the recent breakout as the “fear trade” has all but dissipated. We will continue to watch for technical strength to support adding exposure to portfolios. For now, we remain on the sidelines.
S&P Dividend Stocks, after adding some additional exposure recently the index broke out to new highs. We are holding our positions for now with stops moved up to recent lows.
Bonds and REIT’s finally had some profit taking hit these positions last week on the “risk” rotation. As stated last week:
“REIT’s are looking to break out of a long consolidation cycle and bonds remain favorable. Continue holding current positions for now but we are looking to take some profits and rebalance holdings.”
We did take profits in bonds and are looking for the next opportunity to add more exposure on a further pullback that does not violate bullish trends.
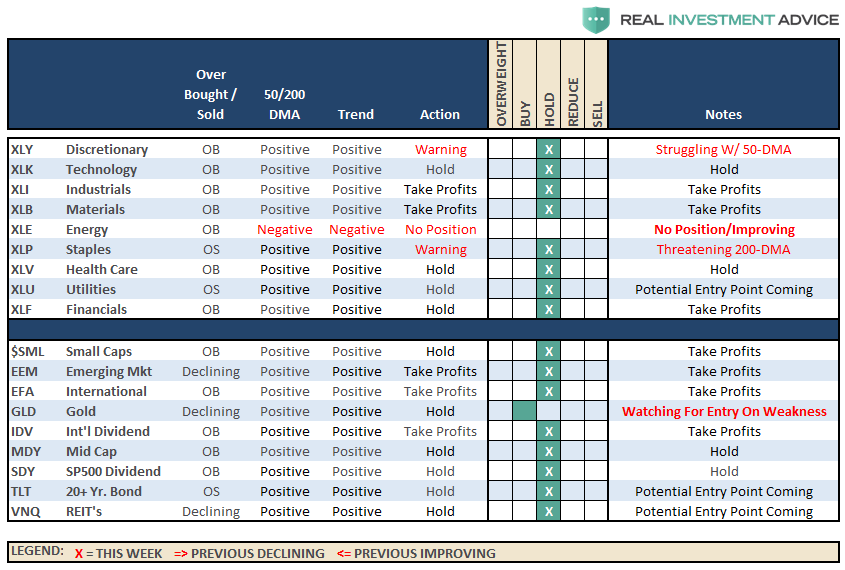
Sector Recommendations:
The table below shows thoughts on specific actions related to the current market environment.
(These are not recommendations or solicitations to take any action. This is for informational purposes only related to market extremes and contrarian positioning within portfolios. Use at your own risk and peril.)
Portfolio Update:
The breakout of small and mid-cap stocks over the last two weeks supports the ongoing bullish trend of the market. As noted above, this trend keeps our portfolios allocated toward equity risk. We remain cautious of potential corrections giving the length of time the markets have been absent one, but there is no use fighting the excessively bullish sentiment for now. The break of the market above 2500 allowed us to allocate some capital in new accounts toward equity-related risk.
Also, as noted, we used the pop in interest rates to move cash management accounts, and larger cash holdings into our cash allocation strategy providing for better yields.We also added some new bond exposure to accounts and are looking for additional opportunities if rates push higher over the next couple of weeks.
We remain extremely vigilant of the risk that we are undertaking by chasing markets at such extended levels, but our job is to make money as opportunities present themselves. Importantly, stops have been raised to trailing support levels and we continue to look for ways to “de-risk” portfolios at this late stage of a bull market advance.
As always, we remain invested but are becoming highly concerned about the underlying risk. Our main goal remains capital preservation.
THE REAL 401k PLAN MANAGER
The Real 401k Plan Manager – A Conservative Strategy For Long-Term Investors
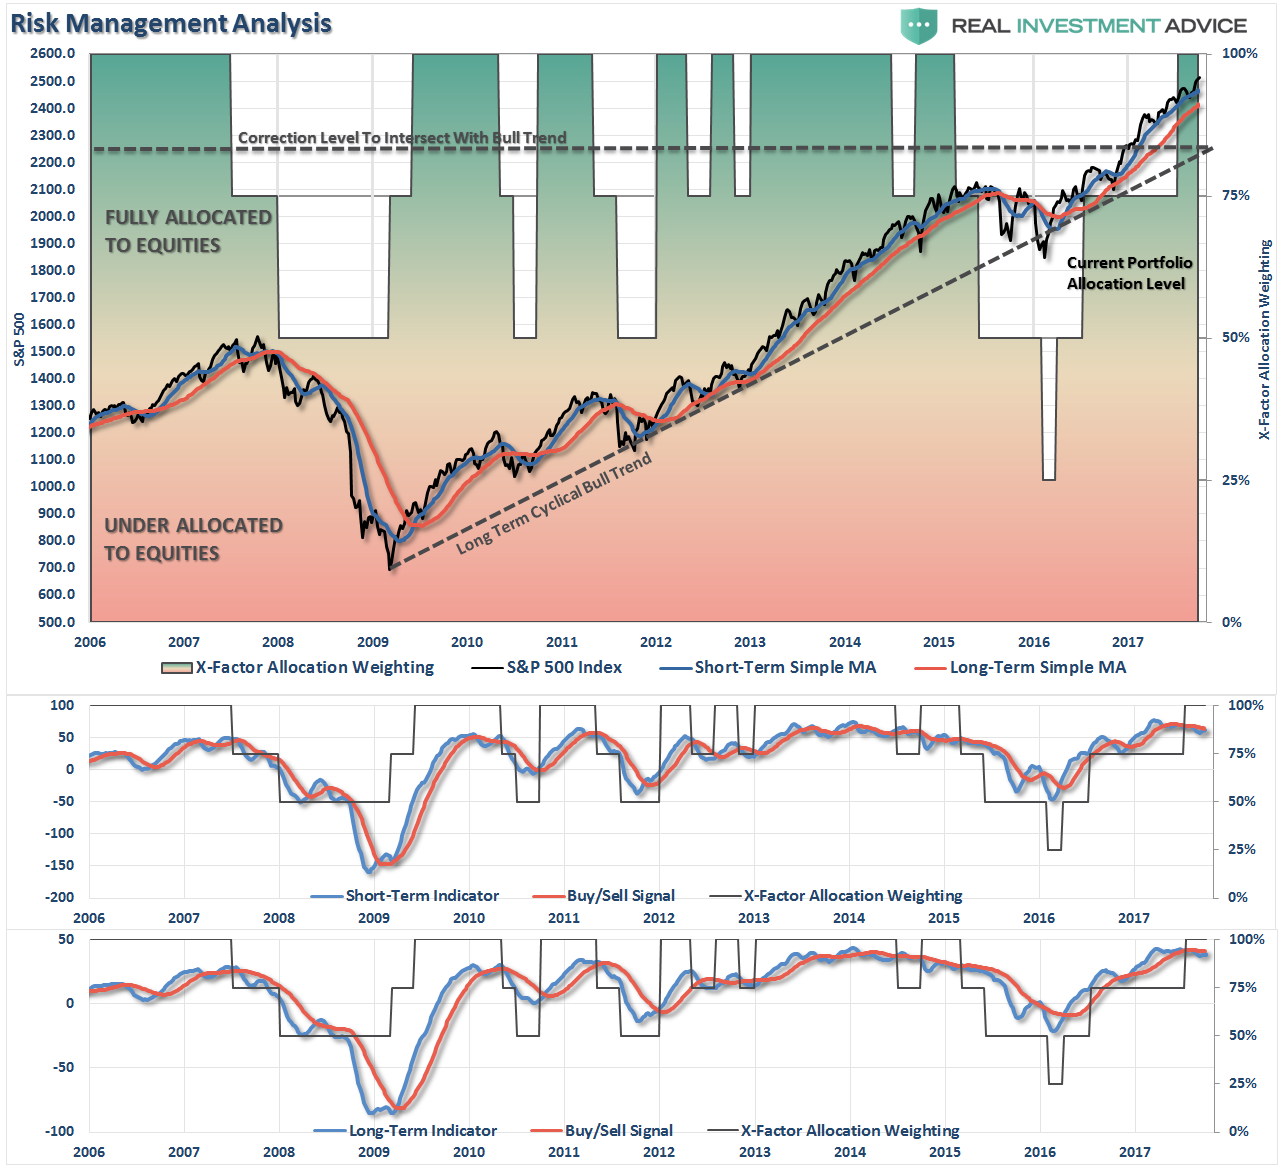
There are 4-steps to allocation changes based on 25% reduction increments. As noted in the chart above a 100% allocation level is equal to 60% stocks. I never advocate being 100% out of the market as it is far too difficult to reverse course when the market changes from a negative to a positive trend. Emotions keep us from taking the correct action.

Bull Charge Picks Up Steam
As noted last week, bullish trends remain in place, so portfolio allocations remain at target levels for now.
With markets extremely extended, rebalancing risk in portfolios by trimming overweight equity exposure and adding to fixed income exposure is a prudent goal this week.
Keep allocations as close to TARGET percentages as possible for now.
All NEW contributions to plans should currently be adjusted to cash or cash equivalents like a stable value fund, short-duration bond fund or retirement reserves. Stop loss levels should be moved up accordingly.
If you need help after reading the alert; don’t hesitate to contact me.
Current 401-k Allocation Model
The 401k plan allocation plan below follows the K.I.S.S. principle. By keeping the allocation extremely simplified it allows for better control of the allocation and a closer tracking to the benchmark objective over time. (If you want to make it more complicated you can, however, statistics show that simply adding more funds does not increase performance to any great degree.)
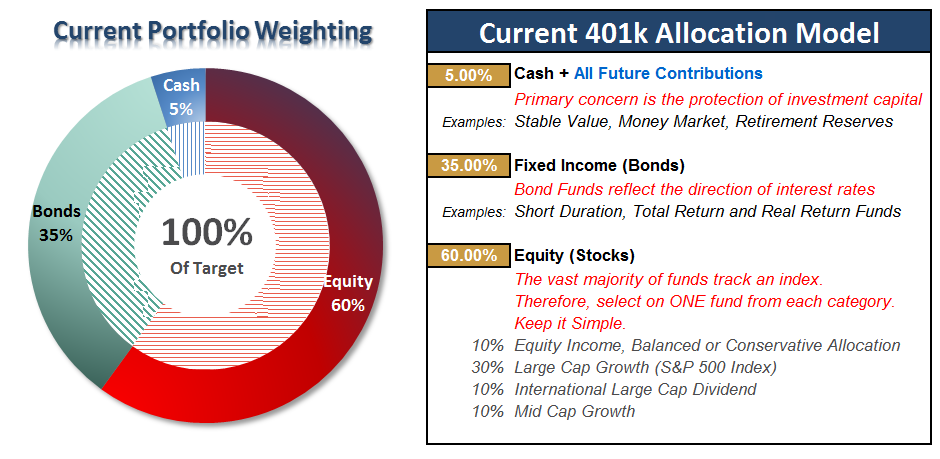
401k Choice Matching List
The list below shows sample 401k plan funds for each major category. In reality, the majority of funds all track their indices fairly closely. Therefore, if you don’t see your exact fund listed, look for a fund that is similar in nature.

Disclosure: The information contained in this article should not be construed as financial or investment advice on any subject matter. Streettalk Advisors, LLC expressly disclaims all liability in ...
more

