
Bond Volatility Soars To 3 Year High
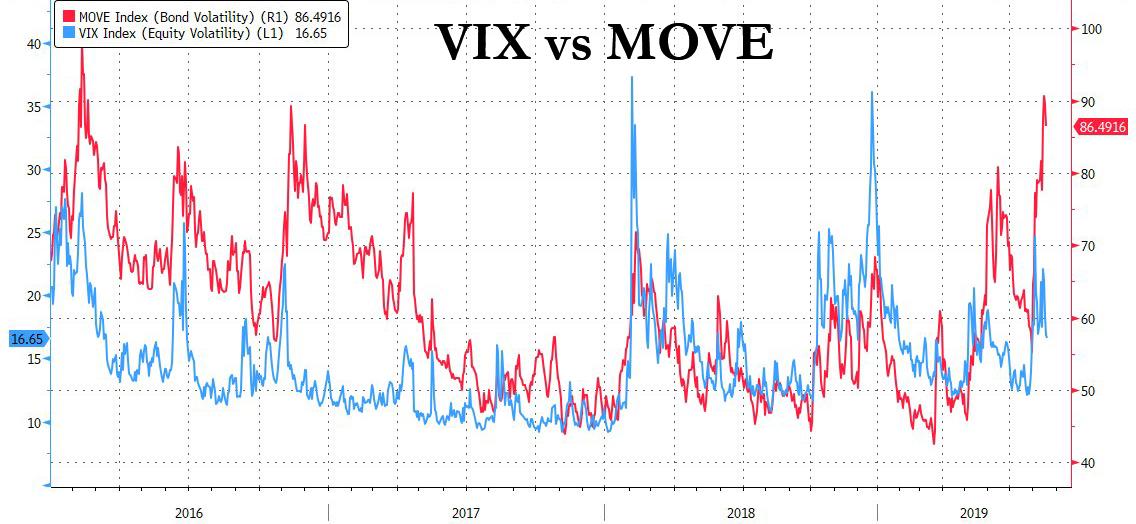
Over the past two years, there has been a distinct trend in capital market volatility: after several years of relatively higher bond market vol as measured by the MOVE index, which coincided with fading implied equity vol (especially in the record low for volatility 2017), equity vol exploded on two distinct occasions: the infamous February 2018 VIXtermination event, and the December 2018 mini bear market. On those two occasions, bonds were relatively well-behaved even as the VIX spiked above 35.
All that changed in August.
Amid growing risks of recession, an ongoing trade war, and geopolitical pressure in Hong Kong, Italy, and Argentina, stock markets had a modest increase in volatility in August. Indeed, as of 16-Aug, the S&P 500 (SPX) has seen an intraday high/low trading range of at least 1% for 13 consecutive days, only the 9th time this has occurred since the end of 2011 (the streak came to an end on Monday as the S&P's intraday range was only 0.60%). What's more, the index's intraday high/low range has risen dramatically to 1.66% on average over the last 10 days (and as high as 1.80% on 13-Aug), the widest since January 19 and in the 94th percentile since 2011.
(Click on image to enlarge)
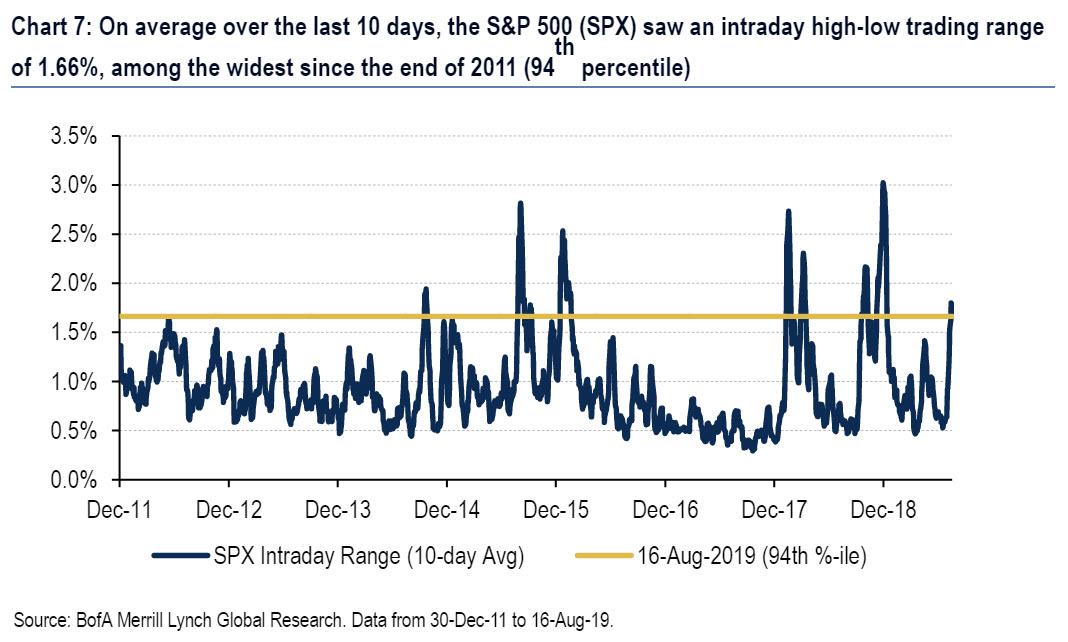
As a result, S&P realized vol has been driven substantially higher, from as low as 6% in mid-July (in the 6th percentile since 1990) to above 25% recently in the 91st percentile since the start of 1990. Meanwhile, after rising as high as 25, implied vol, or the VIX index, has resumed its slide and was trading below 17 at last check, below its long-term average of 20.
Yet while implied equity vol remains artificially suppressed thanks to activist central banks who - either directly or indirectly - sell vol, bond market vol has been rather excitable, and as shown in the chart below, the MOVE bond vol index hit a 3 year high late last week...
(Click on image to enlarge)
... as overall market volatility has shifted and safe assets have inverted with stocks now far less jumpy than bonds, which are seen as the fulcrum class in the central bank transmission mechanism which is also why recently the average yield on non-US bonds dropped to negative.
But it's not just the MOVE index: as Bank of America writes today, the recent rally in US Treasuries has drastically boosted rates vol, especially in the shorter-dated space, as the 2y10y portion of the yield curve inverted for the first time since 2007. As the bank's rates strategists said, they ultimately do expect a flatter curve than they did previously - but caution that the risk-off move is likely to revert in the short-term with the Jackson Hole Fed meeting coming up; meanwhile BofA's technical rates strategists think that Treasuries are at overbought levels.
Finally, for those who believe short-term swaps are a better representation (and instrument) of bond market volatility than the MOVE, BofA points out that 3m-1m ATM vol term structure has rarely been more inverted than it is now: currently 3m vol is 2.05% below 1m vol and in its 2nd %-ile since 2008...
(Click on image to enlarge)
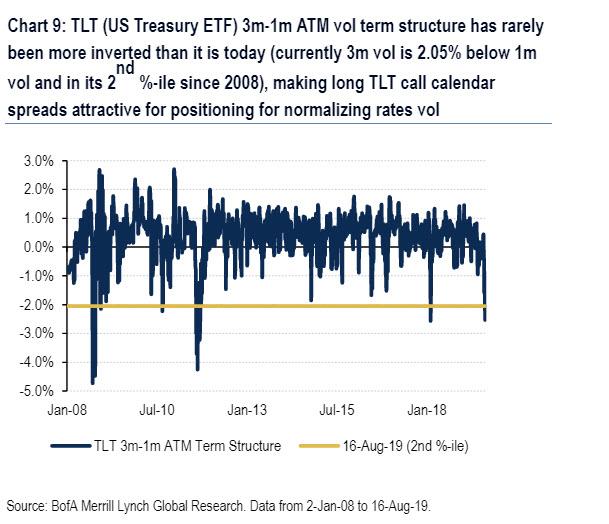
... and as such, BofA advises traders to go long TLT call calendar spreads (selling 1m calls to buy 3m calls) as attractive for positioning for normalizing rates vol and a short-term re-steepening of the curve.
Disclosure: Copyright ©2009-2019 ZeroHedge.com/ABC Media, LTD; All Rights Reserved. Zero Hedge is intended for Mature Audiences. Familiarize yourself with our legal and use policies every ...
more

