
Bond Bears Still Wrong After All These Years

Last week, we discussed we discussed the massive 3-standard deviation above the 50-MONTH moving average which is something rarely seen through history.

“That extension, combined with extreme overbought conditions multiple levels, has historically not been met with the most optimistic of outcomes.
Importantly, such extensions have NEVER been resolved by a market that moved sideways. But, ‘exuberance’ of this type is not uncommon during a market ‘melt-up’ phase.”
Nothing changed this past week as the “melt-up” phase gains momentum. We are on track currently to ratchet the both the fastest and most numerous sequential milestone advances for the Dow in history.
You can barely print “Dow 2X,000” hats fast enough.
As I noted two weeks ago, we did add some defensive positions to our portfolio allocations while we still retain a fully allocated long-position as well. These defensive “shock absorbers” are simply in place to reduce a volatility shock when, not if, one occurs.
See notes on “Portfolio Changes” below for recent changes to portfolio holdings and allocations.
Bond Bears Still Wrong
- 1/9/18 – Bill Gross Says Bond Bear Market Confirmed
- 1/10/18 – Have We Entered The Bond Bear Market
- 1/11/18 – Has The Bond Bear Market Finally Started
- 1/11/18 – The Bond Bear Is Here
- 1/10/18 – The 3-Decade Bond Bull Market Is In Danger
These are just a few of the latest, but a quick Google search will produce a litany more.
Of course, those headlines are not the first time we have seen such calls made. One of the biggest issues with predictions of rising 10-year bond yields since “bond bears” came out in earnest in 2013, is they have been consistently wrong. For a bit of history, you can read some of my previous posts on why rates can’t rise in the current environment.
- Bond Bears & Why Rates Won’t Rise
- Why Bonds Aren’t Overvalued
- People Buy Payments
- Rates Continue To Defy Logic
- Rates, GDP & Challenges
(Of course, we have been avid buyers of bonds on “rate pops” in our portfolios during that time frame as well.)
As we head into 2018, and beyond, there are many reasons why rates will remain subdued all of which are economic and fundamental in nature. As for Bill’s call for the end of the “bond bull,” this isn’t the first time he has made that call.
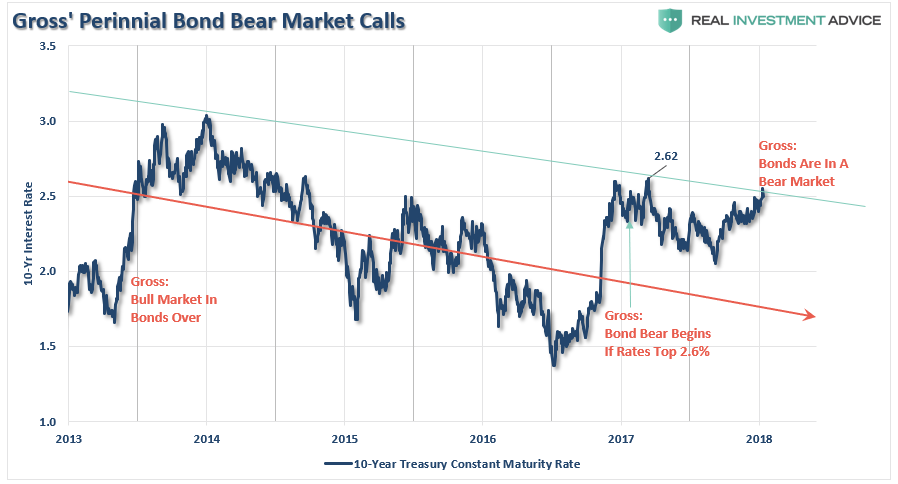
Yet, rates have continued to trend lower.
“The Death Of The Great Bond Bull Market Has Been Greatly Exaggerated.”
As I have written many times previously, rates are a function of economic, wages and inflation.

“Okay…maybe not so clearly. Let me clean this up by combining inflation, wages, and economic growth into a single composite for comparison purposes to the level of the 10-year Treasury rate.”
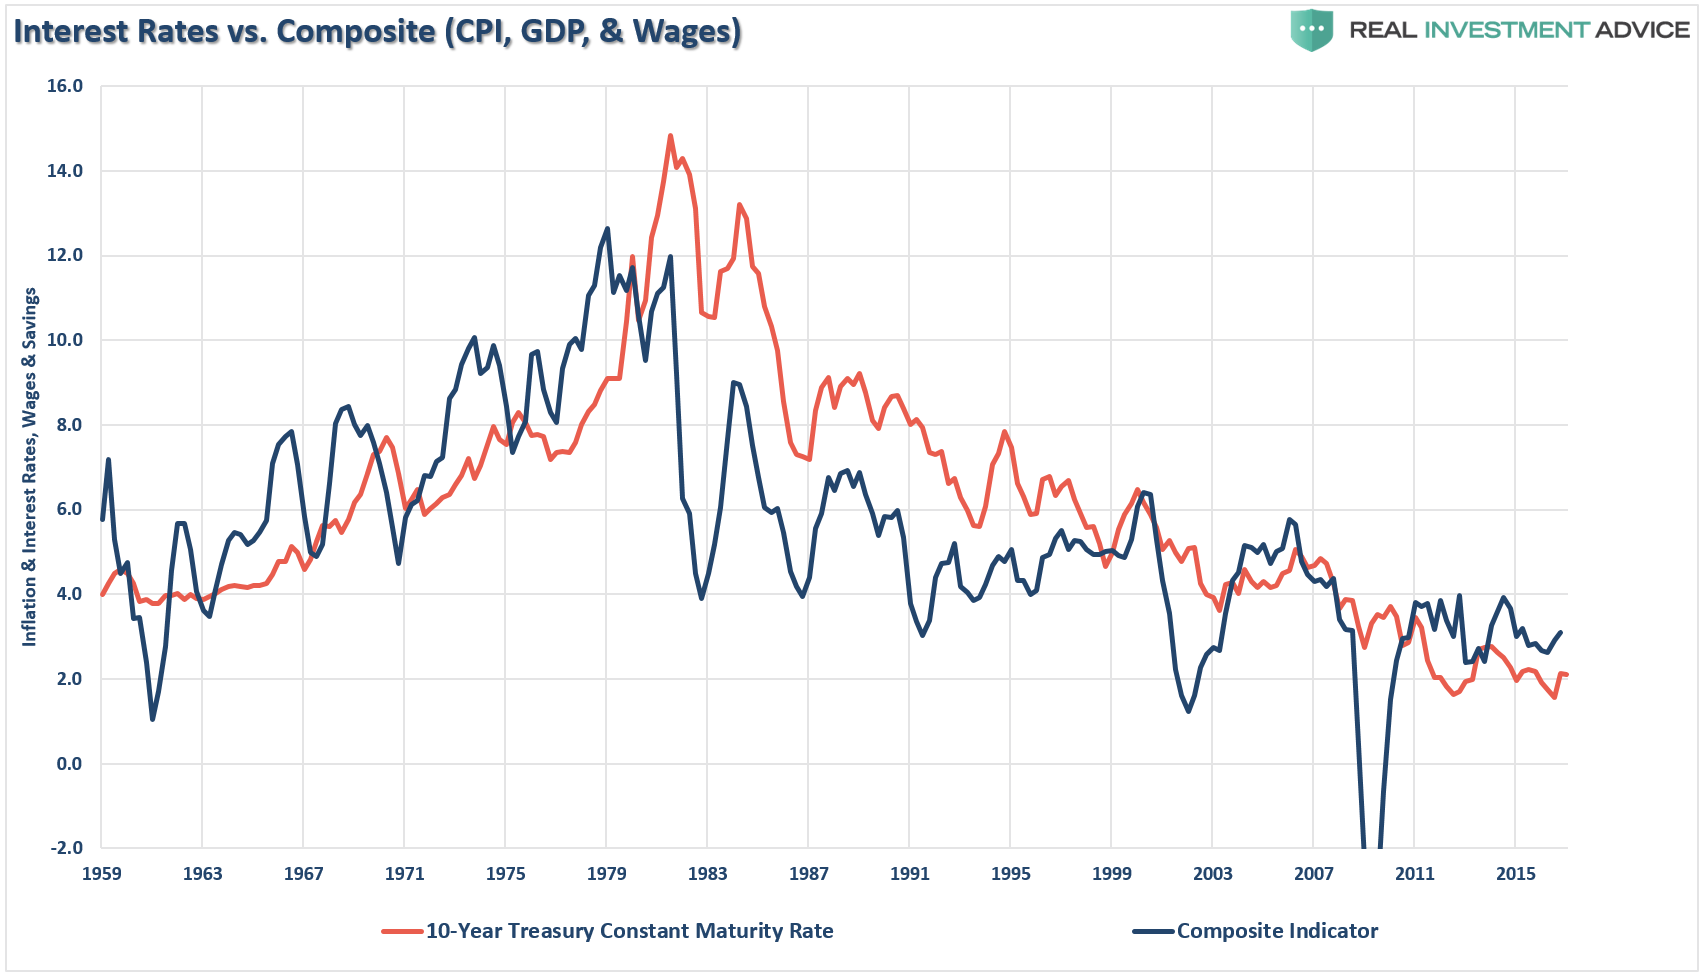
“As you can see, the level of interest rates is directly tied to the strength of economic growth, wages and inflation. With roughly 70% of economic growth derived from consumption, the trend of wage growth should not be readily dismissed.”
The Fed believes the rise in inflationary pressures is directly related to an increase in economic strength. However, as I will explain: Inflation can be both good and bad.
Inflationary pressures can be representative of expanding economic strength if it is reflected in the stronger pricing of both imports and exports. Such increases in prices would suggest stronger consumptive demand, which is two thirds of economic growth, and increases in wages allowing for absorption of higher prices.
That would be the good.
The bad would be inflationary pressures in areas which are direct expenses to the household. Such increases curtail consumptive demand, which negatively impacts pricing pressure, by diverting consumer cash flows into non-productive goods or services.
While inflation ticked-up in December, unfortunately, it came from rising prices in all the WRONG places as shown below.
(Thank you to Doug Short for help with the design)
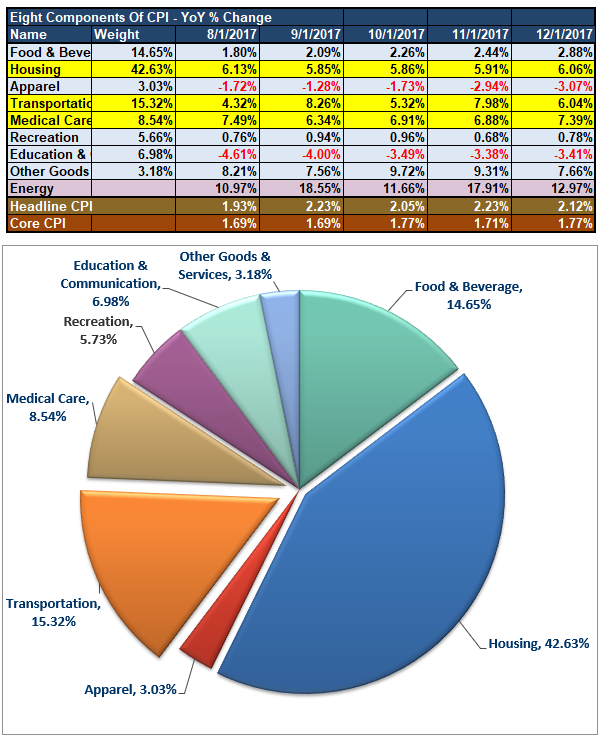
As shown, the cost of Housing, Medical Care, and Transportation have all risen sharply over the past 5-months with those three components comprising 67% of the inflation calculation.
Clearly, the surge in “health care” related costs, due to the surging premiums of insurance due to the “Un-affordable Care Act,” pushed both consumer-related spending measures and inflationary pressures higher. Unfortunately, higher health care premiums do not provide a boost to production but drain consumptive spending capabilities. Housing costs, a very large portion of overall CPI, is also boosting inflationary pressures. But like “health care” costs, rising housing costs and rental rates also suppress consumptive spending ability.
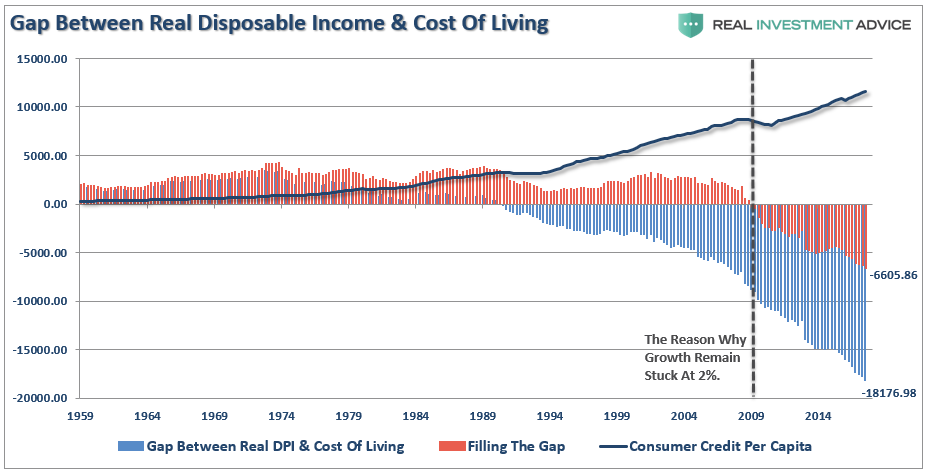
Importantly, while households may be receiving a modest “tax cut” over the coming year, given the rise in three of the biggest expenditures in most households, whatever increase in incomes maybe received has likely already been absorbed by higher costs and debt service payments.
“For the middle-class and working poor, which is roughly 80% of households, rent, energy, medical and food comprise 80-90% of the aggregate consumption basket.” – Research Affiliates

The problem for the Fed is that by pushing interest rates higher, under the belief there is a broad increase in inflation, the suppression of demand will only be exacerbated as the costs of variable rate interest payments also rise.
With households already ramping up debt just to make ends meet, another increased expense will only serve to further suppress “consumer demand.”
This is particularly the case given that wages have not kept up with the pace of inflation as shown below.
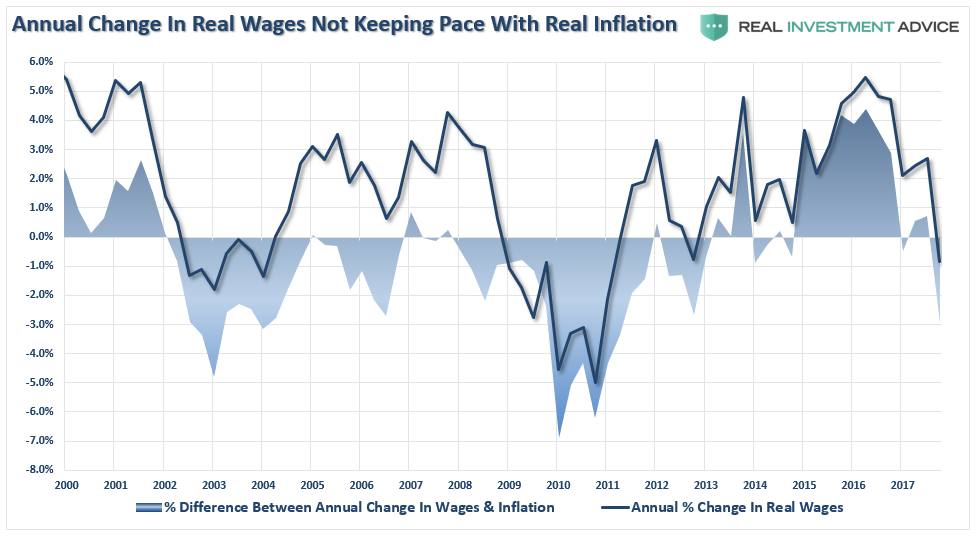
And even the addition of additional debt isn’t closing the gap between the incomes and the median standard of living in the U.S.
The bottom line is that credit markets have been, and continue to be, right all along the way. At important points in time when the Fed signaled policy changes, credit markets have correctly interpreted how likely those changes were going to be. The perfect example is the initial rate hike path set out in December 2015. This was totally wrong and the credit markets were telling us so, right from the start.
It was the analysis of the credit markets which has kept us on the right side of the interest rate argument in repeated posts since 2013.
This time is likely to be no different, particularly as the Fed continues to hike rates into an environment where credit markets continue to scream secular stagnation.
Since 2009, asset prices have been lofted higher by artificially suppressed interest rates, ongoing liquidity injections, wage and employment suppression, productivity-enhanced operating margins, and continued share buybacks have expanded operating earnings well beyond revenue growth.
The Fed has mistakenly believed the artificially supported backdrop they created was actually the reality of a bright economic future. Unfortunately, the Fed and Wall Street still have not recognized the symptoms of the current liquidity trap where short-term interest rates remain low and fluctuations in the monetary base fail to translate into higher inflation.
Combine that with an aging demographic, which will further strain the financial system, increasing levels of indebtedness, and lack of fiscal policy, it is unlikely the Fed will be successful in sparking economic growth in excess of 2%. However, by mistakenly hiking interest rates and tightening monetary policy at a very late stage of the current economic cycle, they will likely be successful at creating the next bust in financial assets.
History is replete with examples of what happens when interest rates rise sharply over a relatively short period of time.

(Pay attention to the overbought condition of rates which is also at historically high levels. With the same overbought condition is rates and stocks, the markets are set up for a full reversion from “risk” to “safety.”)
The problem with most of the forecasts for the end of the bond bubble is the assumption that we are only talking about the isolated case of a shifting of asset classes between stocks and bonds.
However, the issue of rising borrowing costs spreads through the entire financial ecosystem like a virus. The rise and fall of stock prices have very little to do with the average American and their participation in the domestic economy. Interest rates are an entirely different matter.
Since interest rates affect “payments,” increases in rates quickly have negative impacts on consumption, housing, and investment which ultimately deters economic growth.
Given the current demographic, debt, pension and valuation headwinds, the future rates of growth are going to be low over the next couple of decades – approaching ZERO.
While there is little left for interest rates to fall in the current environment, there is also not a tremendous amount of room for increases. Therefore, bond investors are going to have to adopt a “trading” strategy in portfolios as rates start to go flat-line over the next decade.
Of course, you don’t have to look much further than Japan for a clear example of what I mean.
But, for now, Wall Street continues to ignore the giant “secular stagnation” sign staring them in the face.
Market & Sector Analysis
Data Analysis Of The Market & Sectors For Traders
S&P 500 Tear Sheet
Performance Analysis
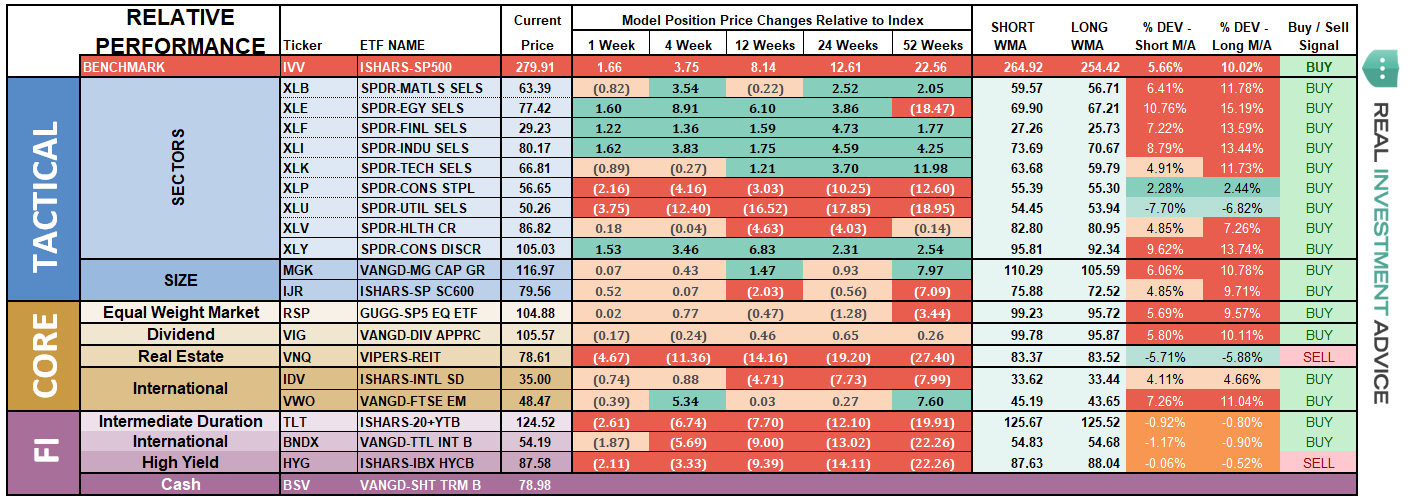
ETF Model Relative Performance Analysis
Sector & Market Analysis:
At the beginning of 2017, I penned the following:
“The video below shows the historical “rotation” of sectors over the last 3-years. As you will notice sectors have consistently ‘swarmed’ in a clockwise rotation going from strongly outperforming the S&P 500 index to strongly underperforming. If you watch to the end of the video you will see the post-presidential election anomaly form.”
I have notated on the Sector Rotation model below, the early stages of the reversion process of that extreme with Treasury’s and Financial’s beginning to trade momentum.
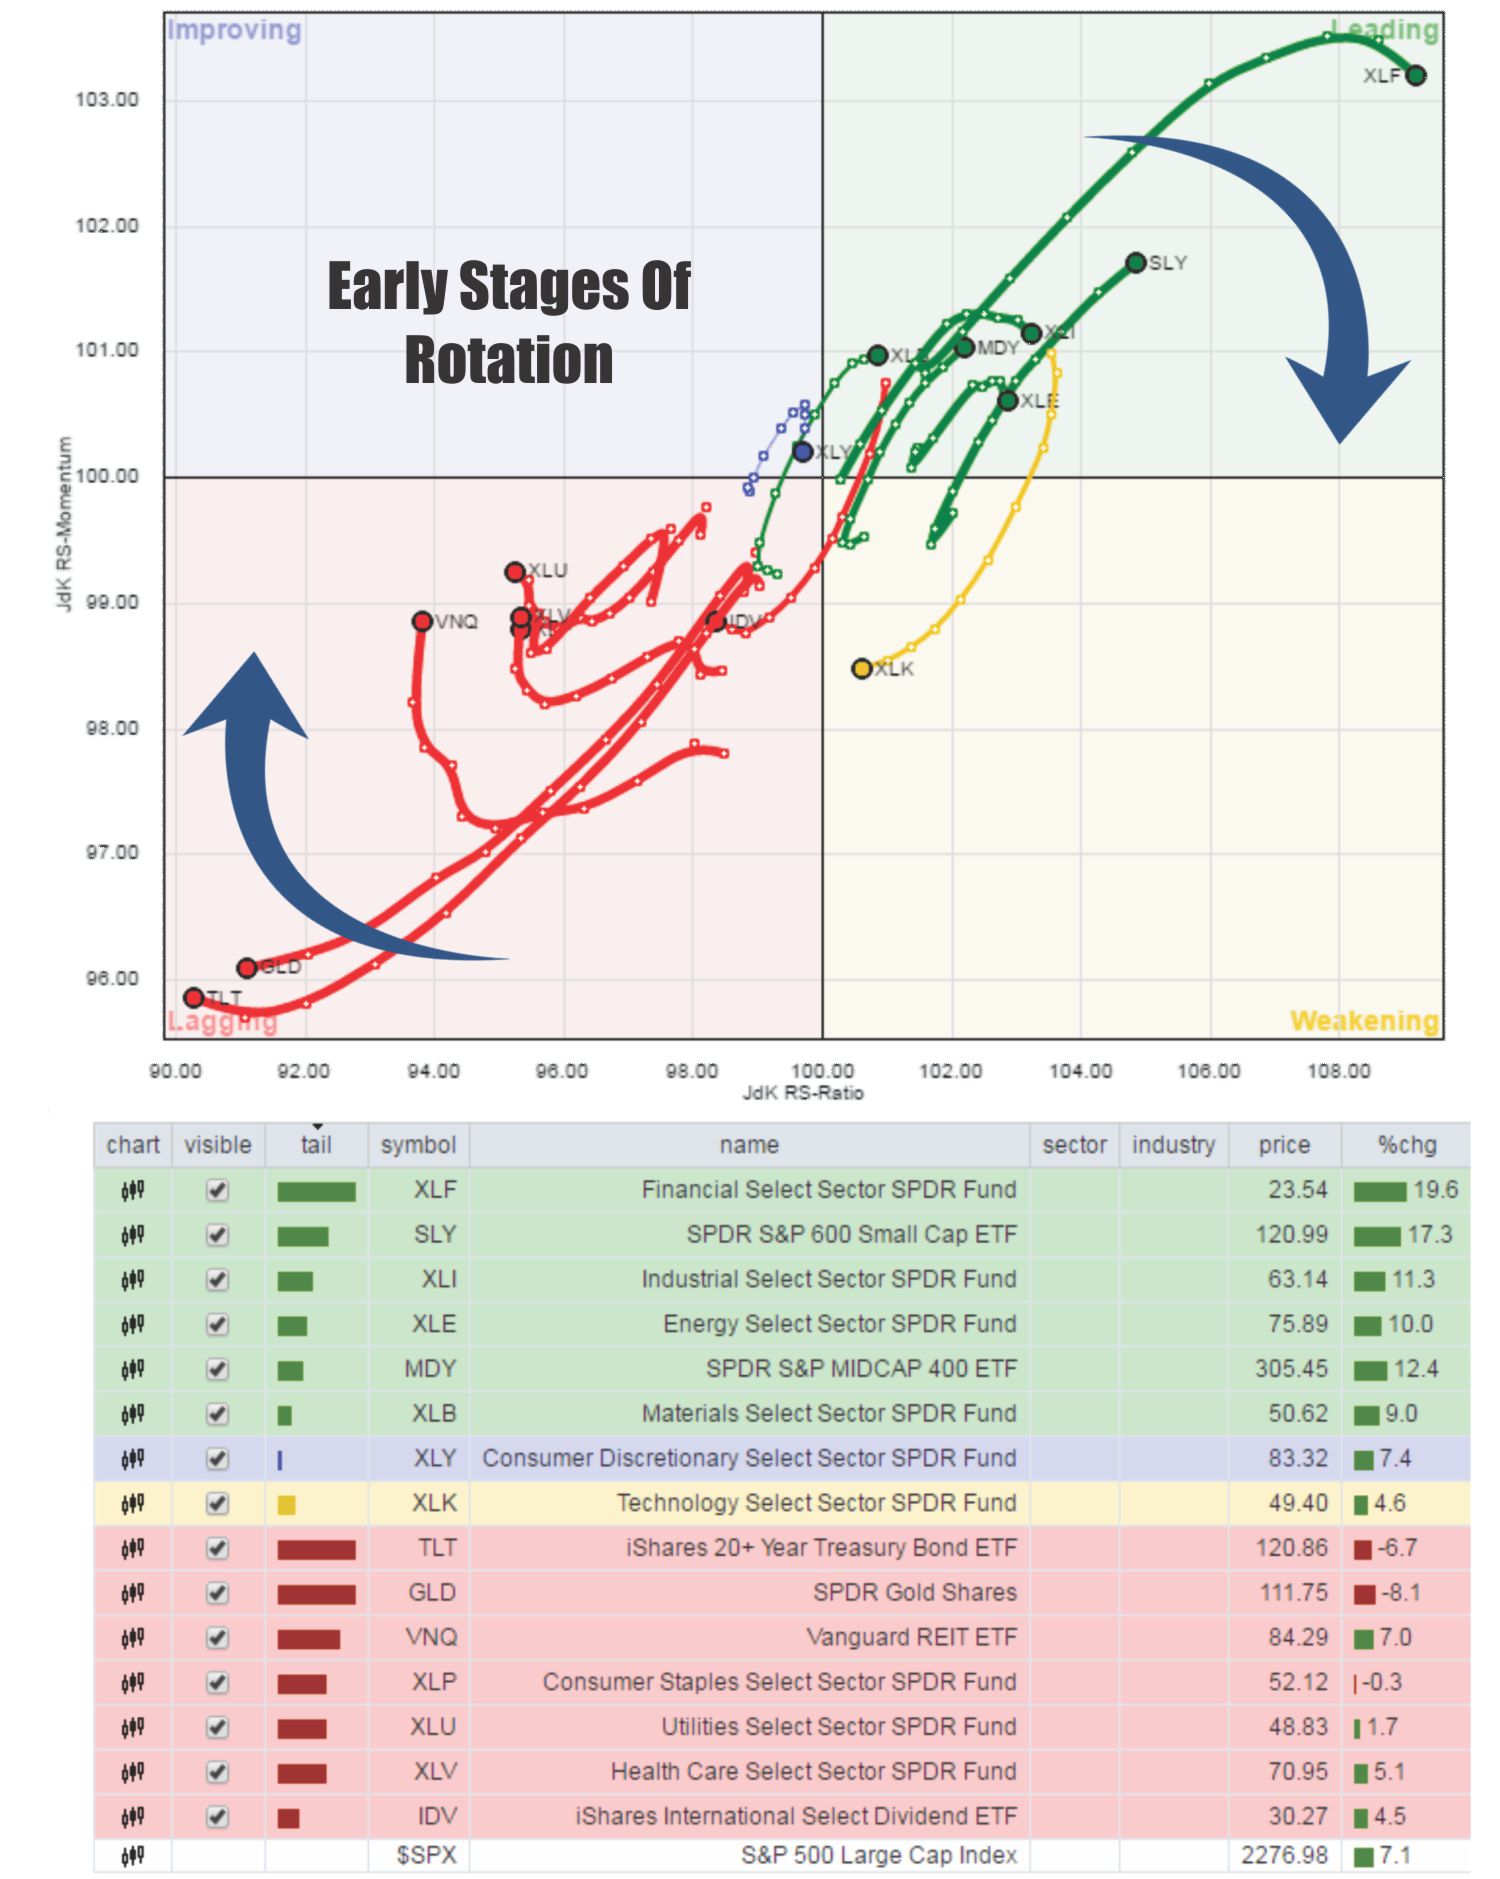
Of course, over the ensuing couple of months, the out-of-favor holdings had a sweeping rotation back to outperforming the S&P 500.
Well, here we are once again, and while not as dramatic of a deviation between outperforming sectors and underperforming, the same setup once again exists.

However, for now…the bulls remain clearly in control. So, this is not yet the time to be overwhelming “bearish” on the market.
But don't disregard the risk, either.
Take a look at the sectors below. Every sector is pushing 2- and 3-standard deviations of longer-term moving averages. This isn’t normal.

Every Sector Except Utilities and Staples – were in full-fledged party mode over the last week as the chase for new-year positioning took hold. The massive overbought conditions in discretionary, staples, materials and industrials need to be trimmed off. Financials and Health Care are extremely overbought as well. Look to rebalance risk next week on any showing of weakness.
Energy – as I noted in December, the positive backdrop developed in the energy sector on a technical basis. We added one-half of a tactical trading position to portfolios last month which has paid off well. However, that trade has gotten way over-extended so look to take profits on any weakness. We are moving up our stop-loss levels as well.
Utilities, we remain long the sector for now and added some weight to the sector as a hedge against a risk-off rotation. With the sector very oversold, look for a risk-off rotation before months end to see a pick-up in the sector.

Small and Mid-Cap stocks as noted below, we recently added to mid-cap and international exposure on their respective breakouts. Trends are positive which keeps allocations in the markets but the extreme overbought conditions make adding exposure here riskier. Look for weakness to take profits and rebalance weights in portfolios.
Emerging Markets and International Stocks as noted below, we added some international exposure on the breakout following the recent pullback. The markets are extremely overbought on every front, so, as with virtually every other position, rebalancing portfolio weights and reducing some risk is prudent.
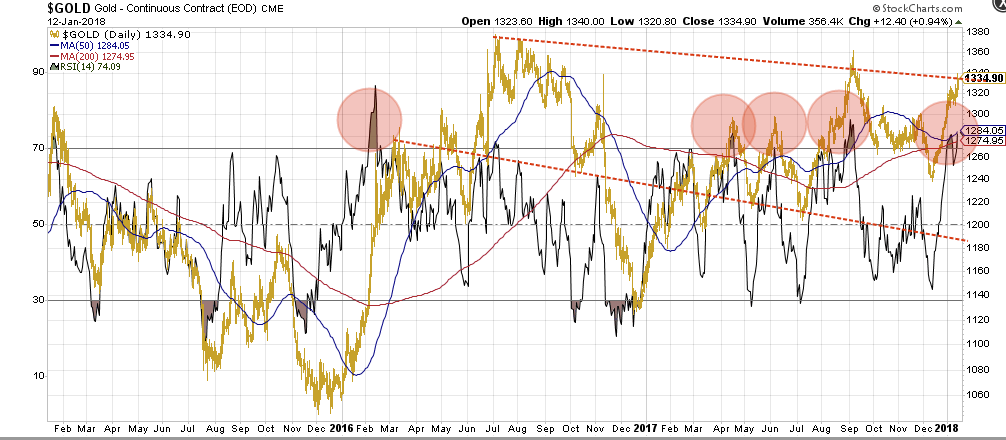
Gold – We have monitored Gold for a long-time and currently still remain on the sidelines after exiting the position back in 2013.However, it is worth noting that Gold has been back on our radar for the last several months. However, as shown in the chart below, Gold appears to be bottoming here, but a series of lower highs keeps us cautious. With Gold back to very overbought levels, which have ends to previous runs, we will continue to look for an entry opportunity on a pullback that does NOT violate important support levels.
S&P Equal Weight & Dividend Stocks – As noted previously, both of these positions have simply gone parabolic as money is chasing yield currently. We have moved up stops and are looking to take profits and rebalance accordingly.
Bonds and REIT’s – We remain long these sectors and did add to them recently on weakness as a hedge against a “risk off” rotation. Our conviction on these positions continue to rise, but we are still honoring our longer-term stop-loss levels.
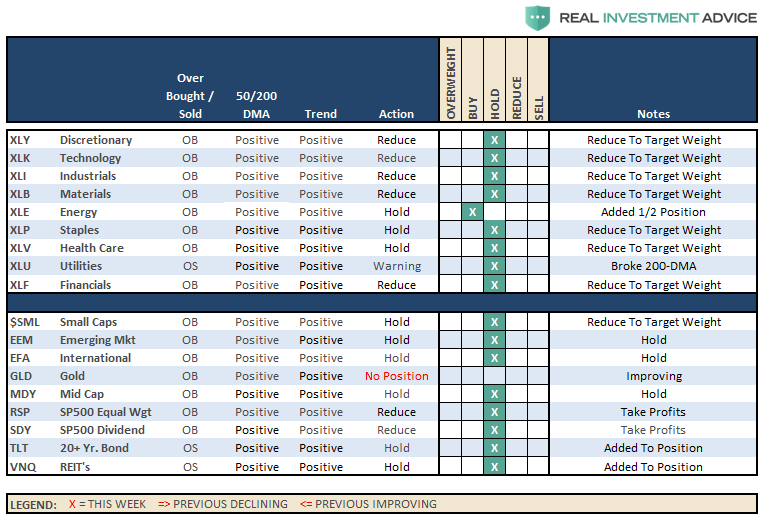
Sector Recommendations:
The table below shows thoughts on specific actions related to the current market environment.
(These are not recommendations or solicitations to take any action. This is for informational purposes only related to market extremes and contrarian positioning within portfolios. Use at your own risk and peril.)
Portfolio Update:
Also, as noted two weeks ago, hedges have been added to our portfolios given the recent surge in the markets.
- Rebalanced positions to target portfolio weights
- Added exposure to bonds, utilities and REIT’s bringing allocations up to portfolio weight.
- Add a tactical trade of a short S&P 500 position to hedge risk.
- Moved up stops on all positions to current support levels.
On our long side, we added a tactical trading position in Energy over a month ago. Our analyst, Jesse Colombo, also found two more good opportunities recently where we increased our exposure to Russell 2000 and Japan on recent breakouts.
While our hedges are taking a bit of a beating as of late, they are small relative to the long-side of our portfolio. As always, we remain fully invested but are becoming highly concerned about the underlying risk. Our main goal remains capital preservation which is why we are de-risking portfolios where and when we can.
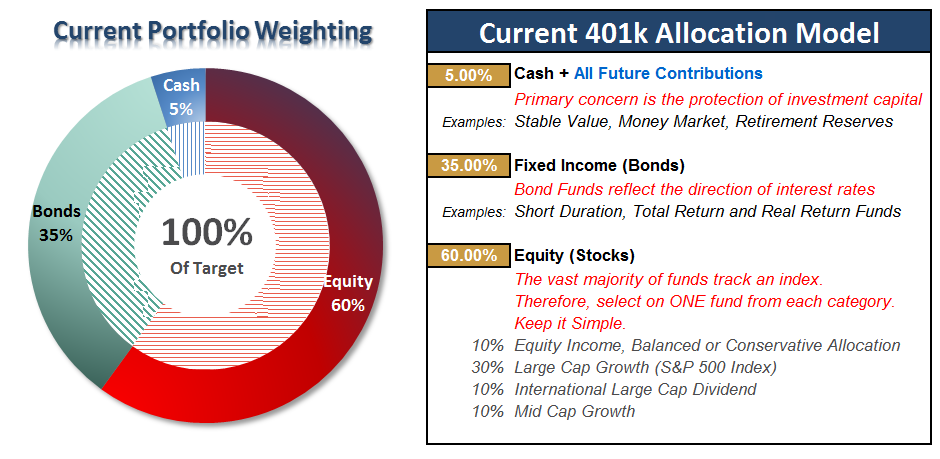
THE REAL 401k PLAN MANAGER
The Real 401k Plan Manager – A Conservative Strategy For Long-Term Investors

There are 4-steps to allocation changes based on 25% reduction increments. As noted in the chart above a 100% allocation level is equal to 60% stocks. I never advocate being 100% out of the market as it is far too difficult to reverse course when the market changes from a negative to a positive trend. Emotions keep us from taking the correct action.

This Is Even Nuttier
At the beginning of December, I penned a blog entitled “This Is Nuts,” in which I noted the extreme levels of exuberance that was invading the markets at that time. Well, as noted above in the main body of this missive, it has gotten even “Nuttier.”
However, the bullish backdrop remains intact but extensions are getting way out of hand here.
The Dow is set, at the current run rate, to hit another 1000-point milestone at the fastest pace in history and will be up 6000 points in the past year. Think about that for a moment. The Dow will, in just one year, gained roughly 25% of its entire price since 1880. (6000 divided by 26000)
It’s just nuts.
While portfolio allocations remain at target levels, for now, the time for complacency is now gone.
I have added a couple of notations to the 401k plan manager graph above. The markets have now pierced the top of the long-term bullish trend channel, which only happens either at the peaks or troughs of a market trend. Secondly, as noted by the arrows, with the markets extremely overbought and extended, risk outweighs reward at this juncture.
Importantly, note the orange horizontal lines I have added in the two bottom buy/sell signal indicators. The market has never been this overbought since I began tracking our model in 2006. (Just for the record, it hasn’t been this overbought since the turn of the century when I began running this model in the newsletter.)
Given the inability to hedge 401k-plans, I continue to recommended rebalancing risks in portfolios by trimming overweight equity exposure and adding to fixed income exposure.
All NEW contributions to plans should currently be adjusted to cash or cash equivalents like a stable value fund, short-duration bond fund or retirement reserves. We will use these funds opportunistically to add to weightings when corrections occur.
Current 401-k Allocation Model
The 401k plan allocation plan below follows the K.I.S.S. principle. By keeping the allocation extremely simplified it allows for better control of the allocation and a closer tracking to the benchmark objective over time. (If you want to make it more complicated you can, however, statistics show that simply adding more funds does not increase performance to any great degree.)
401k Choice Matching List
The list below shows sample 401k plan funds for each major category. In reality, the majority of funds all track their indices fairly closely. Therefore, if you don’t see your exact fund listed, look for a fund that is similar in nature.

Disclosure: The information contained in this article should not be construed as financial or investment advice on any subject matter. Streettalk Advisors, LLC expressly disclaims all liability in ...
more

