Are National Financial Conditions Saying The Stock Market Is In Big Trouble?
The Chicago Fed National Financial Conditions Index allows us to better understand the present day in the context of economic and stock market history. According to the Chicago Fed, the National Financial Conditions Index provides:
“A comprehensive weekly update on U.S. financial conditions in money markets, debt and equity markets and the traditional and shadow banking systems. Positive values of the NFCI indicate financial conditions that are tighter than average, while negative values indicate financial conditions that are looser than average.”
Since the yield curve is derived from yields on U.S. government bonds that are backed by the full faith and credit of the U.S. government, the yield curve tells us very little about the market’s perception of default probabilities and counterparty risk. When the National Financial Conditions Index rises, it is indicative of decreasing trust and tighter financial conditions. When the National Financial Conditions Index is falling or at low levels, it is indicative of higher trust within the financial system and more favorable access to capital. Therefore, we can learn something about August 2019 by comparing current financial conditions to financial conditions before large drops in the S&P 500 Index.
HISTORICAL CASES
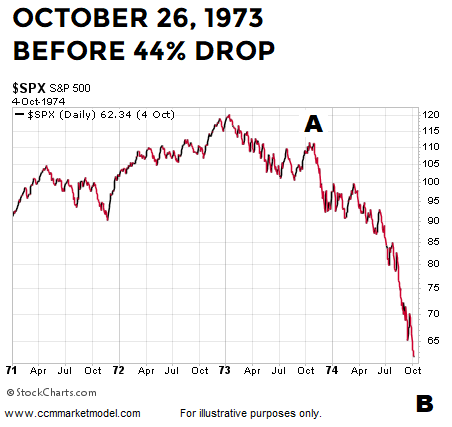
In October 1973, before the S&P 500 dropped 44%, the National Financial Conditions Index had a reading of 2.13, which aligns with much tighter than average financial conditions and lower levels of confidence and trust.
(Click on image to enlarge)
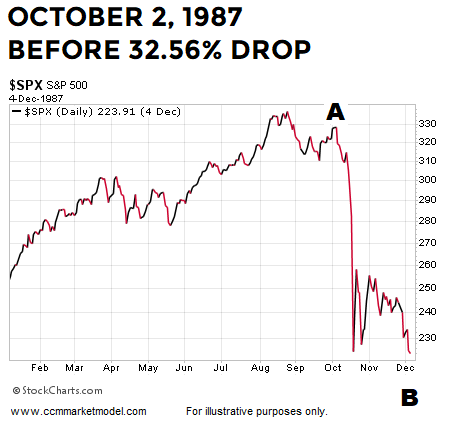
In October 1987, before the S&P 500 dropped 33%, the National Financial Conditions Index had a reading of 0.02.
(Click on image to enlarge)
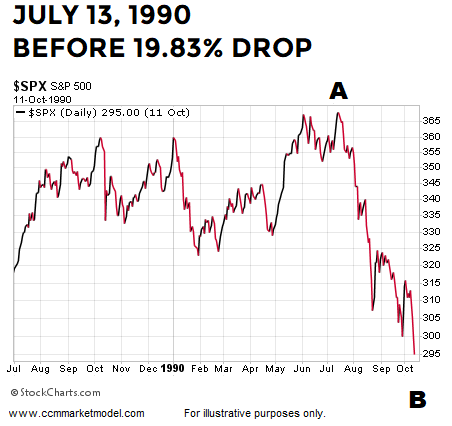
In July 1990, before the S&P 500 dropped 20%, the National Financial Conditions Index had a reading of -0.20.
(Click on image to enlarge)
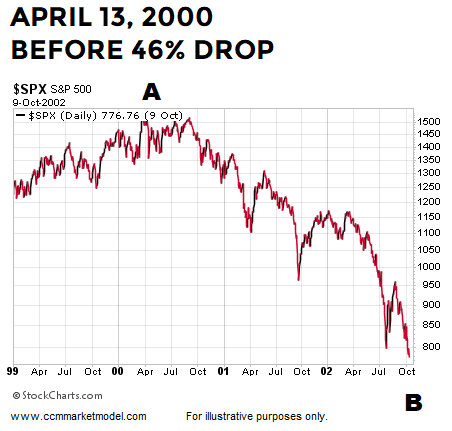
In April 2000, before the S&P 500 dropped 46%, the National Financial Conditions Index had a reading of -0.18.
(Click on image to enlarge)
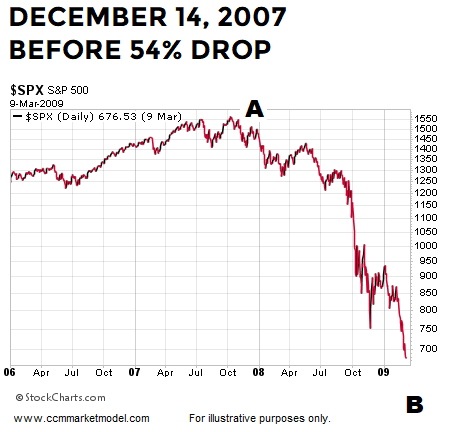
In December 2007, before the S&P 500 dropped 54%, the National Financial Conditions Index had a reading of 0.32, which aligns with tighter than average financial conditions and lower levels of confidence and trust.
(Click on image to enlarge)
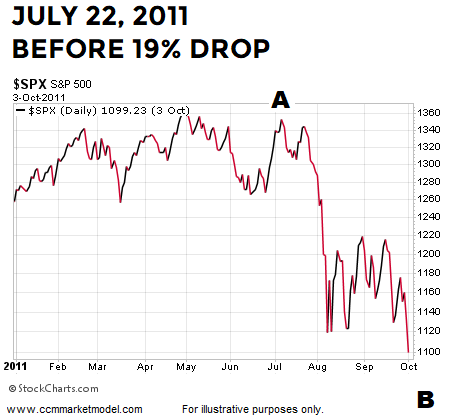
In July 2011, before the S&P 500 dropped 19%, the National Financial Conditions Index had a reading of -0.25%.
(Click on image to enlarge)
HOW DO FINANCIAL CONDITIONS COMPARE IN 2019?
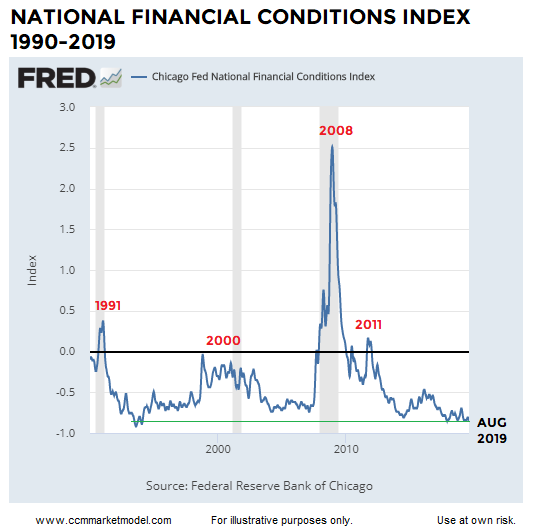
Remember, according to the Chicago Fed, “negative values indicate financial conditions that are looser than average.” Therefore, the lower the reading the better. The last reading of the National Financial Conditions Index was posted on August 2 and came in at -0.85, which is the most favorable reading relative to the cases above by a wide margin. In fact, the August 2, 2019, reading is one of the most favorable readings seen in the last decade and looks much better than the last elevated period in 2011.
(Click on image to enlarge)
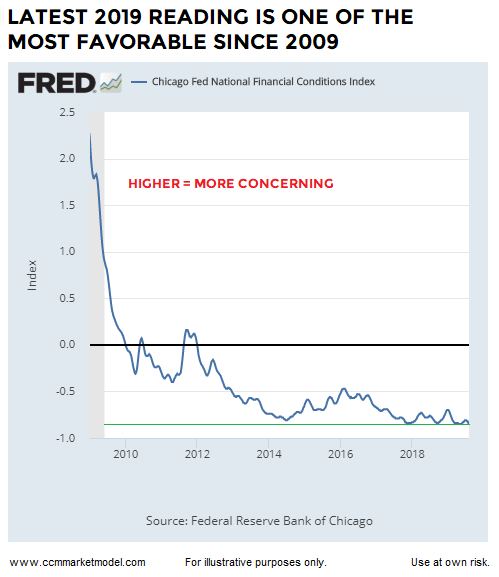
If we go back to 1990, the graph below shows current financial conditions are much more favorable than they were near recessionary periods in 1990-91, 2000, and 2007-09 (shaded areas). Concerns in the present day would increase if the National Financial Conditions Index started to spike higher, as it did in July 2007.
(Click on image to enlarge)
YIELD CURVE AND BIGGER PICTURE
The 10-2 yield curve is moving closer to inversion, which means market participants believe the Fed is on the verge of what could be multiple rate cuts in the coming months. Since the yield curve has been covered by the media for over two years, it is possible 10-2 yield curve inversion could trigger some heavy selling, especially in the short run. If credit spreads begin to widen in a material manner and the National Financial Conditions Index begins to rise closer to the -0.10 to 0.30 range (last 2019 reading was -0.85), stock market concerns would increase. Given present-day financial conditions remain constructive relative to history and given the material covered in this week’s stock market video, it is prudent to remain open to all outcomes.
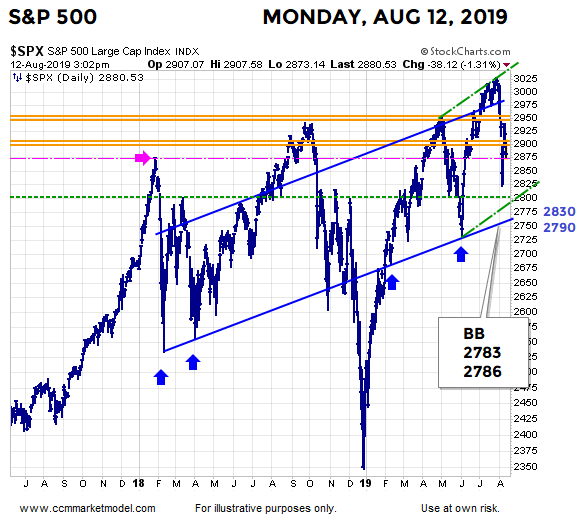
BULL/BEAR GUIDEPOSTS
As noted last week, it would not be surprising to see the S&P 500 revisit the 2790 to 2830 area. At the end of last week, some notable Bollinger Band levels sat at 2783 and 2786. On Monday afternoon August 12, the S&P 500 was trading above all these levels at 2880. From a probability perspective, we will learn something either way (market holds, market drops below and holds below these levels).
(Click on image to enlarge)