
Are Junk Bonds Suggesting A Stock Market Top Is Near?
As investors, we have several tools and indicators at our disposal.
Whether it is technical indicators such as Fibonacci levels, moving averages, or price supports, or fundamental indicators such as corporate earnings or economic data, we have a lot of information to use when making decisions.
Today’s chart incorporates both. Junk Bonds play a critical role in highlighted investor sentiment. When junk bonds (lower-rated debt) is performing well, then that means investors are taking more risks. When junk bonds struggle, that means investors are taking on less risk.
(Click on image to enlarge)
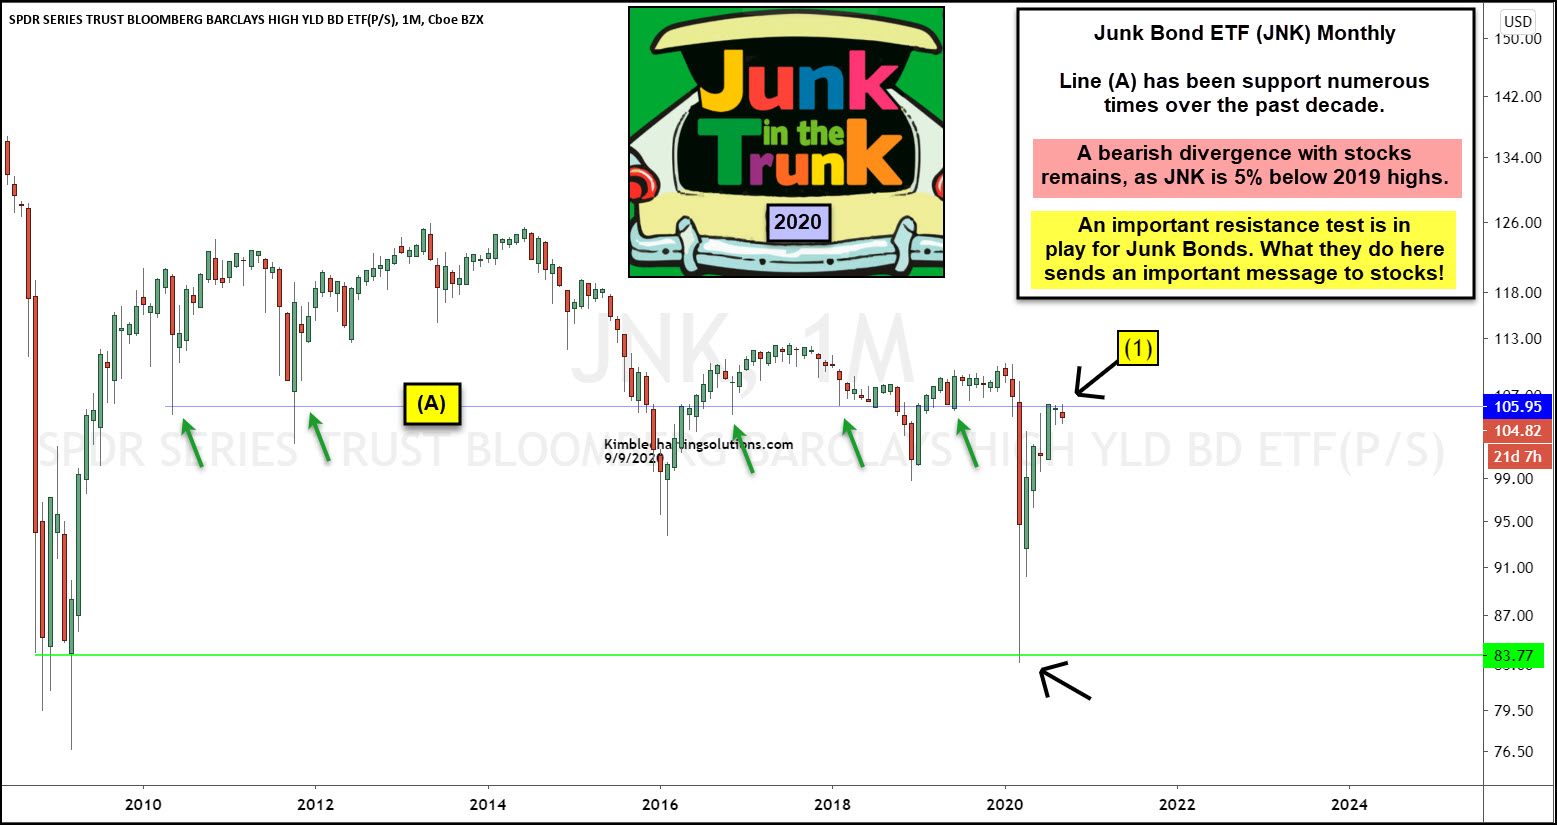
So today, we highlight the Junk Bonds ETF (JNK). Using technical analysis, we can see that JNK is trading near line (A), a price level that has served as support and resistance over the past several years. It is currently serving as price resistance.
At the same time, there is a divergence between the stock market (the S&P 500 made new all-time highs) and Junk Bonds (well below all-time highs and 5 percent off 2019 highs).
So this is an important resistance test for junk bonds. Will Junk Bonds (JNK) break down from here (bearish) or break out (bullish).
What happens here will send an important message to stocks (and investors)!
Disclosure: Sign up for Chris's Kimble Charting Solutions' email alerts--click here.


