
Are Inverted Yield Curves “Fake News”?

One of the main stories in the money and bond markets of late has been the development of inverted yield curves in the Treasury (UST) market. Indeed, a variety of intra-maturity spreads have witnessed negative readings over the last few weeks, but when the UST 2-Year/10-Year curve went inverted, that’s when the headlines started picking up steam. Since inverted yield curves have been predictive measures of future economic downturns, this newfound occurrence has created a narrative that, perhaps, a recession could be looming for the U.S. economy a year or so from now. However, is it that simple of an analysis in 2022, or could an inverted UST 2s/10s curve prove to be the bond market’s version of “fake news”?
I’m a big proponent of the adage “the market is a lot smarter than me,” but you know what’s different this time around? The Fed just finished purchasing almost $5 trillion in securities. Of its total UST acquisitions, maturities of five years or greater represented 42% of the buying. I think a rather reasonable case can be made that this round of quantitative easing has kept the recent increase in the UST 10-Year yield under wraps, and when the Fed begins its balance sheet drawdown (quantitative tightening) perhaps as soon as next month, this “cap” will begin to fade.
10-Year Treasury Constant Maturity Minus 2-Year Treasury Constant Maturity
(Click on image to enlarge)
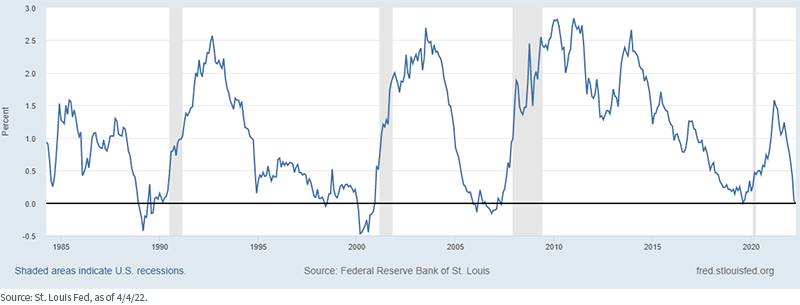
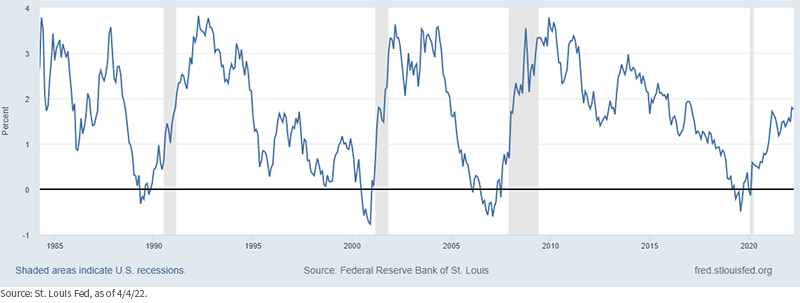
So, let’s take a look at an alternate yield curve measure that is also closely followed, the UST 3mo/10yr gauge. Once again, much like the UST 2s/10s differential, this construct has a very good track record as being a leading indicator of a recession following an inversion. However, if you look closely at these two graphs, you’ll notice two completely different landscapes. In the case of the UTS 2s/10s curve, it is quite clear there has been a distinct narrowing trend, with the spread declining by more than 80 basis points (bps) year-to-date. In contrast, the UST 3mo/10yr spread has actually widened 40 bps thus far in 2022. Admittedly, this curve should also narrow as the Fed continues to raise rates, but it has a far longer runway to work with before it could potentially go inverted.
10-Year Treasury Constant Maturity Minus 3-Month Treasury Constant Maturity
(Click on image to enlarge)
For the record, the 2020 recession that followed the last time yield curves went inverted deserves some second-guessing. I think a case can be made that if the U.S. and the rest of the world did not experience a once-in-a-generation pandemic, the American economy would not have experienced a contraction.
Conclusion
The bottom-line message is that the Fed has only just started the process of removing “emergency” measures, and monetary policy is nowhere near entering restrictive territory. Equally as important, the U.S. economy is in rather solid shape, a fact that was underscored by the March jobs report. These are two very important factors to consider in the discussion of inverted yield curves and recession.


