
A Succinct Look At Risk Indicators
There are many moving parts in the financial markets, making predictions incredibly hard to do with any consistency. It’s my belief that earnings and interest rates are the main driver of stock prices over the long term. But liquidity conditions are also a very important piece of the puzzle and can have a large impact on short term trends. Let’s briefly look at where some important risk indicators currently stand.
(Click on image to enlarge)
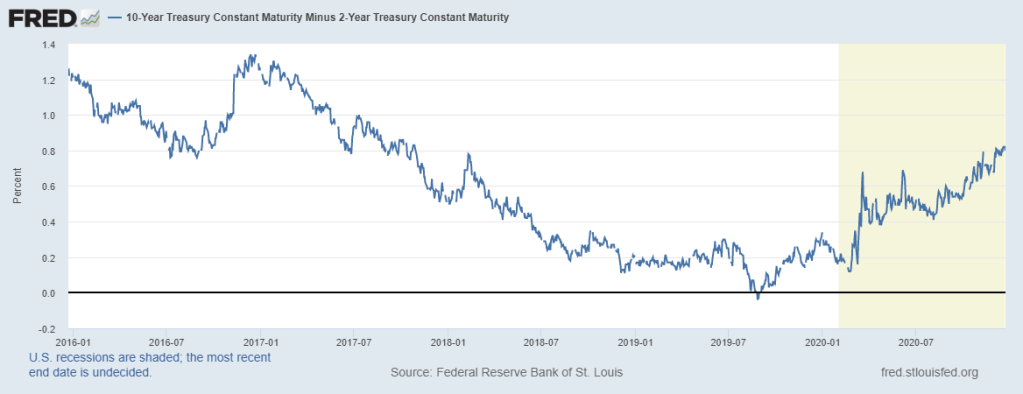
Yield Curve
The difference between the rates on 2-year and 10-year treasury bonds are as high as they have been in 3.5 years. The market is looking ahead to stronger economic growth and/or inflation expectations. The yield curve is one of the best leading indicators of recessions. When it drops into negative territory, it is a sign of internal stress within credit markets.
The trade war with China, along with the Fed raising rates, offset some of the benefits of lower corporate tax rates and reduced regulations. Credit conditions tightened from 2017 to 2019 – leading to a sharp decline in markets during Q4 2018 (Christmas crash) – until the Fed stopped raising rates and lowered them back to 0% again. Credit conditions are in much better shape today.
(Click on image to enlarge)

St Louis Fed Stress Index
The St. Louis Fed Financial Stress Index incorporates a variety of important indicators to compile an index that shows how good/bad underlying financial conditions are. Economic recessions coincide with sharp increases in the stress index. Currently, the index is deep in negative territory, signaling underlying financial conditions remain positive.
(Click on image to enlarge)

High Yield Credit Spreads
The next chart shows the difference between high yield (junk) bond rates in comparison to treasuries. Treasuries are considered the safest of all fixed-income investments, and during the bad times investors will demand a higher premium on junk bonds to compensate them for the additional risk. When times are good, and investors are more optimistic, this additional premium will shrink. Currently, the high yield spread hasn’t completely recovered from pre-COVID levels, but it's below the historical average.
(Click on image to enlarge)

Investment Grade Credit Spreads
Investment-grade bond spreads are similar, but investment grade is comprised of debt from companies with much better balance sheets and therefore lenders have a better chance of getting paid back in full (lower risk). Same outlook here, as higher spreads coincide with worse financial conditions. These spreads are as low as they have been in a while. No underlying credit risks showing up in either high yield or investment grade speads.
(Click on image to enlarge)

Real Fed Funds Rate
The above chart shows the Fed Funds rate minus the rate of inflation. Clearly, the Fed is very accommodative as the real rate remains deep in negative territory. No threats here.
This also shows the price you pay for “safety”. Yes, money market and bank account principals don’t fluctuate like stocks and bonds, but the price you pay is losing ground (or purchasing power) over time. It’s basically a guaranteed loss of 1.5% to 2.0% each year.
(Click on image to enlarge)

Gold
Which is a perfect Segway to Gold. The negative real return on cash increases demand for other assets like commodities, digital currencies, and dividend-paying stocks. This is the Fed’s goal and since they have pledged to keep rates at 0% for years, I expect this trend to continue.
The above chart shows Gold has held support around the $1780 zone I pointed out before. It’s been a battle between the 50-day and 200-day moving average since.
Going forward, there is a resistance zone that stands between $1917 and $1923. Which consists of potential resistance at $1917, which matches the size of the biggest retracement rally during the decline from $2089, and then the prior all-time high at $1923.70.
If price can break above that resistance zone, the prior swing high at $1966.10 looks to be the final hurdle on Gold’s path to new highs.
(Click on image to enlarge)
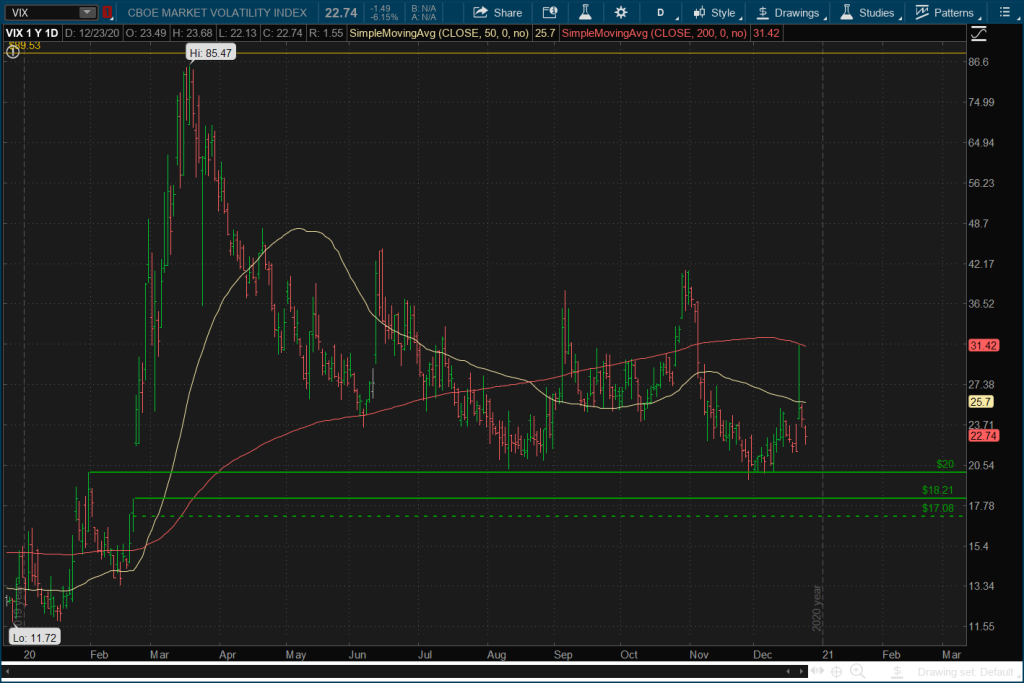
VIX
Despite the stock market making new highs, the Volatility Index (VIX) can’t seem to get below the important 20 level. There is still a lot of uncertainty especially in the next month with runoff elections to decide the Senate, softening of economic data, and COVID restrictions. This doesn’t surprise but I’d still love to see a VIX below 20 soon.
Summary: The majority of the risk indicators are in decent shape. Overall liquidity conditions appear to support the economic and financial market recovery. But the uncertainty and unpredictability of COVID makes this a fluid situation that could change dramatically in very short order. As investors, all we can do is focus on what is tangible at the moment, and ensuring your portfolio is consistent with your risk tolerance and time horizon. After that, we can take advantage of the opportunities that the market may give us.
Disclaimer: None.


