A Strong Economy And Risks For The Markets
Summary
- The latest business cycle started in early 2020.
- Commodities and interest rates responded as suggested by historical patterns.
- The latest data point to a strong cycle ahead and increased risks for the markets.
The economy is strong, no doubt about it. The trend of the business cycle and financial markets reflects the current positive economic conditions. The markets are reacting as they have typically done during this phase of the business cycle.
The business cycle moves in waves because it reflects justifiable miscalculations by business managers about the desired level of inventory needed to meet expected demand. It is a complex decision biased by the continuous vociferous comments from analysts and commentators.
The bottom line for decision-makers is how much to produce to meet demand through the supply chain.

Source: www.peterdag.com
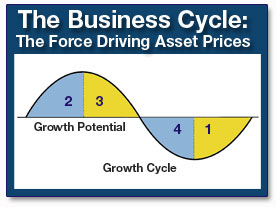
Why does the economy slow down? Why does the business cycle move from Phase 2 to Phase 3? Where is the current position of the business cycle now?
These are crucial questions. Their answer drives tactical and strategic investment decisions, and it shows the risks facing the markets.
The major causes for the economy to slow down and the business cycle to transition from Phase 2 to Phase 3 are: rising commodities, rising interest rates, and rising inflation.
During Phase 2 of the business cycle managers are focused on building inventories to meet rising demand for their products. Demand is strong and production must be increased aggressively. To do so business has to purchase raw materials, hire production workers, and increase borrowing to finance the production process.
Toward the end of Phase 2 the intensity of building up inventories causes inflation and interest rates to rise to levels hindering consumers’ purchasing power and consumers’ confidence. The outcome is demand starts slowing down.
Business remains optimistic about the future and does not recognize this change in demand. They keep ramping up production to keep plants operating at full capacity. Eventually, however, inventories are rising at a much faster pace than demand, causing profitability to suffer. The inventory/sales ratio shows a visible rise.
The decision must be made to reduce production to cut inventory accumulation and bring it in line with the slower growth in demand. Purchases of raw materials are reduced. Workers are laid off. Borrowing is cut as reduced production requires cut in financing.
This process continues through Phase 3 and Phase 4. The outcome is continued weakness in commodities, lower interest rates, and lower inflation.
Eventually, at the end of Phase 4, inventories are brought in line with demand. Consumers’ optimism improves because of lower inflation and interest rates. Demand increases and business is forced to increase production accordingly. Phase 1 is now underway.
In order to increase production business raises purchases of raw materials, hires more production workers causing income to improve, and increases borrowing to finance production. These events feed on themselves throughout Phase 1 and Phase 2.
Where are we now? Recent data about the inventory to sales ratio published every month by the Census (see chart below) help us to answer this question.

A rise in the I/S ratio means inventories are rising more rapidly than sales. This is a bearish sign for the economy because business will be forced to cut production to lower inventory accumulation and bring inventories in line with the slowdown in demand. This process and its impact on the markets have been discussed in detail in my article The Inventory Cycle – Boring But Important Market Setter. An in-depth report showing what happens during a complete business cycle is also available to visitors of www.peterdag.com.
The above graph shows the I/S ratio started to decline sharply in early 2020. It signaled business was heavily understocked compared to demand. Inventories were reduced too aggressively.

Source: Federal Reserve of St. Louis
The outcome, as shown in the above chart, has been a sharp rebound in production (blue line) and manufacturing employment (red line), reflecting the business decision to increase production to replenish inventories.

Source: StockCharts.com
Because of increased production, as shown on the above chart, yields, copper, lumber, and crude oil all moved higher. Exactly as it is supposed to happen in Phase 2 of the business cycle.

Source: StockCharts.com
The above chart shows the graph of the business cycle. Its trend is computed in real-time and updated in each issue of The Peter Dag Portfolio Strategy and Management.
The current rising trend of the graph shows the business cycle is still improving. The recent sharp increase in inflation, commodities, and long-term interest rates suggests we are much closer to the end of Phase 2 than the beginning of Phase 1.
As long as the I/S ratio declines and our business cycle indicator rises, the trends of the markets shown in a previous chart will continue to rise. They will reverse when the business cycle starts to slow down. This is the time the I/S is likely to bottom and move higher. Its increase will reflect an unwanted accumulation of inventories which will be followed by production cuts.
These trends will signal the business cycle is entering Phase 3 and the outcome will be a decline in commodities and interest rates.
Key takeaways
The current decline in the I/S ratio is forcing business to increase production.
Copper, lumber, crude oil, and bond yields are rising because of the increased production needed to build up inventories as manufacturers try to catch up with demand.
The sharp increase in commodities and interest rates suggests the business cycle is much closer to the end of Phase 2 than the beginning of Phase 1.
The transition from Phase 2 to Phase 3 will be accompanied by a peak in yields and commodities and increased equity market volatility. A prolonged market correction should be expected at that time.
A complimentary subscription to The Peter Dag Portfolio Strategy and Management is available to the readers of this article on more


