
A Brief History Of Major Financial Bubbles, Crises, And Flash-Crashes
WHAT YOU NEED TO KNOW ABOUT FINANCIAL BUBBLES AND MANIAS
Throughout history, there have been numerous speculative economic bubbles and manias. Some were relatively isolated events which held limited or no broad economic ramifications, while others resulted in a full-blown financial crisis or marked the end of important eras.
In more recent times, flash-crashes have become another unusual but very different type of short-term threat to the marketplace as an unintended consequence of rapidly growing dependence on technology and algorithmic trading. Keep reading a brief history of bubbles and manias and how they impacted the trading landscape.
WHAT ARE FINANCIAL MARKET BUBBLES AND MANIAS?
Bubbles and manias have been around as long as financial markets have, and for as long as human nature remains the same these episodes of severe market dislocations will continue to develop and unravel as they have in the past. Over and over.
The history of bubbles begins in the 17th century. The first recorded market bubble – the Tulip mania – dates all the way back to 1636-1637, and yet after nearly 400 years, we find ourselves today amidst the deflating of the Bitcoin bubble that reached its crest in December 2017. Of all the historical bubbles, only Bitcoin’s final blow-off stage rivaled that of the one seen during the Tulip craze, and in total, from the beginning to the end only the Bitcoin bubble has exceeded it.
Indeed, a perfect example of how human nature in the marketplace remains unchanged despite all the advances in technology and the availability of education and information to market participants. The asset type and reason behind the spectacular rise and fall are different, but the irrational behavior of market participants is nearly identical.
The Tulip and Bitcoin bubbles are two of the more unusual occurrences given the type of ‘asset’ they are (were) and sheer magnitude of price appreciation. But along the way between the days of Tulips and Bitcoin, there have been many instances of speculative bubbles and manias, of which some ended very badly for the broader financial markets and economy.
In this article, the history of bubbles and manias has been segmented into two types, with the importance of the asset class to broader financial markets as the dividing factor. ‘Normal’ market bubbles if you can call them that, are those which involved major markets (i.e. stock markets, commodities) and ‘abnormal’ market bubbles are those involving ‘niche’ markets with limited to no macro-impact.
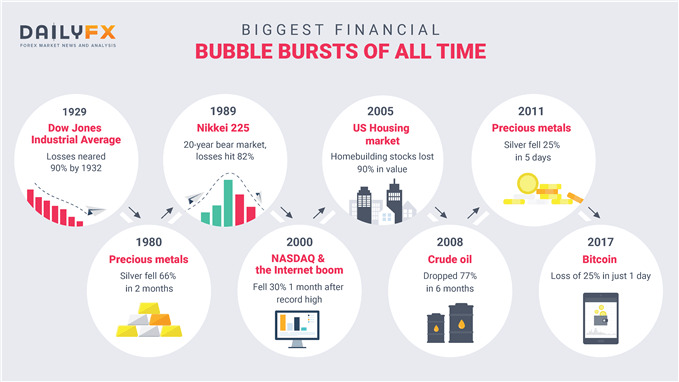
MAJOR MARKET BUBBLES (10 YEARS TO THE PEAK, 2 AFTER)
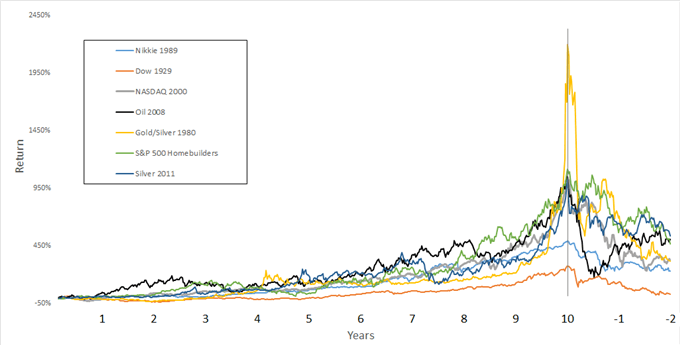
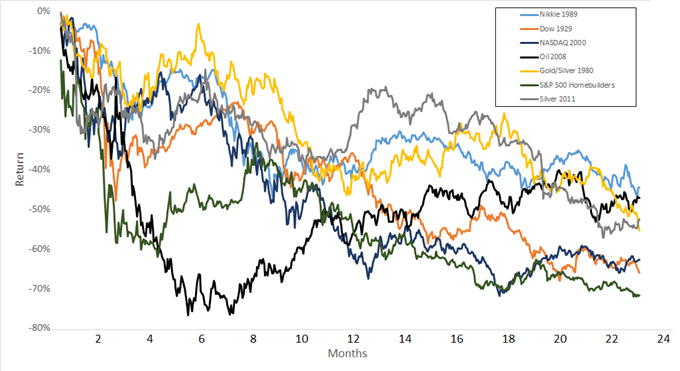
2 YEARS AFTER THE TOP
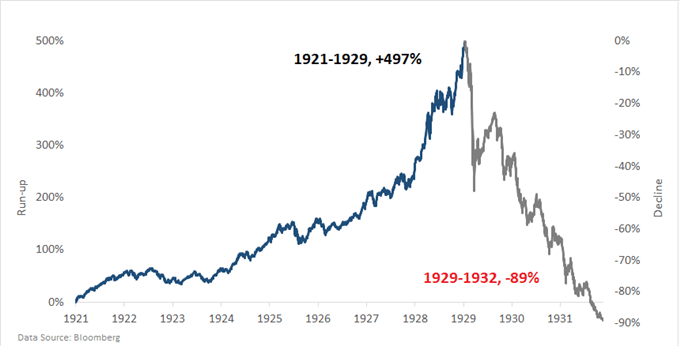
Dow 1929 (led to the 1930s depression)
The first major developed-world bull market that led to excessive speculation and extreme valuations took place during the ‘roaring ‘20s’ and culminated in the 1929 top. While the gains during the decade leading up to the top were relatively tame by comparison to other major speculative bubbles, the fall-out was tremendous with the Dow Jones losing 89% from the top on September 3, 1929, to the trough on July 7, 1932. Along with the collapse of stock prices came the ‘Great Depression’, a recession which lasted over three and a half years and saw unemployment spike to nearly 25%.
Precious metals 1980 (Marked the top of the ‘70s inflation cycle)
In what was one of the largest manipulations in market history, the Hunt brothers, sons of oil tycoon H.L. Hunt, attempted to corner the silver market. This helped drive the price of silver to a peak of $49.45 on January 18, 1980, from approximately $6 just a year earlier.
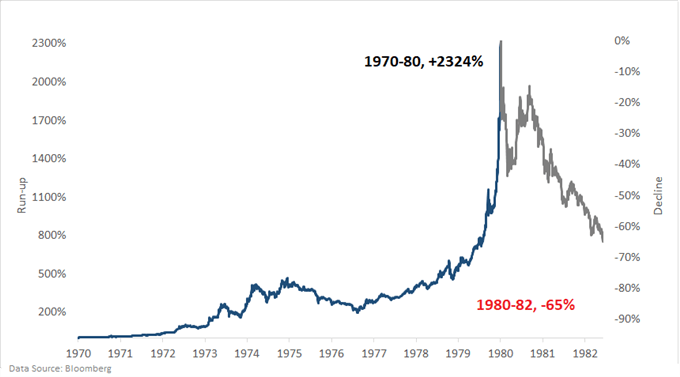
In less dramatic fashion, during the same time-frame gold rose from about $225 per ounce to a high of $843 on January 21, 1980. It’s worth noting, though, that gold rose a staggering 2300% over the 10 years leading up to the top.
Silver
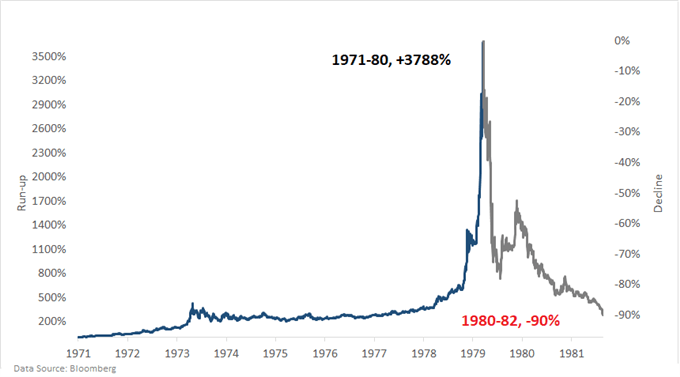
The fallout was significant, by the middle of 1982 silver declined all the way down to under $5, or 90% from the top, while gold traded to under $300, or -64% from the peak. While there weren’t any significant negative macroeconomic ramifications, the top in precious metals came at the end of the ‘70s spike in inflation and interest rates which haven’t been seen since.
Gold
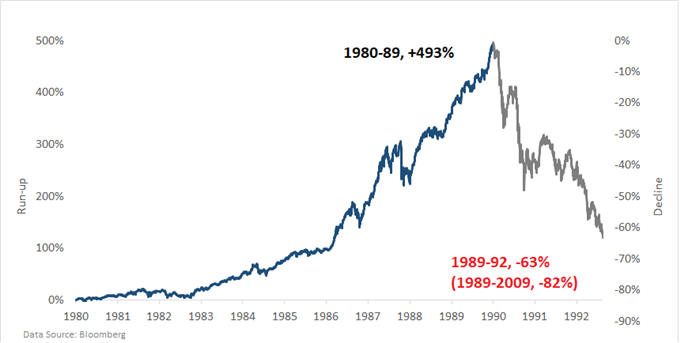
Nikkei 1989 (Led to the lost decade+)
In the history of bubbles, this is one of the greatest stock market rises and declines of all time, not only due to its sheer size but because the Japanese market has failed to trade back anywhere near the record high since. The Nikkei topped on December 29, 1989, and lost 63% until August 1992 before stabilizing for a few years. From top to bottom, however, the index lost nearly 82% from 1989 to its eventual bottom which came in 2009 on the heels of the Great Financial Crisis.
In the wake of the decline, the Japanese economy suffered several recessions, and real estate valuations which were also driven to unsustainable heights during the boom plummeted as well. The fallout eventually led to the BoJ adopting a 0% interest rate policy in the late 90s and the development of quantitative easing, a policy which has largely been in place since.
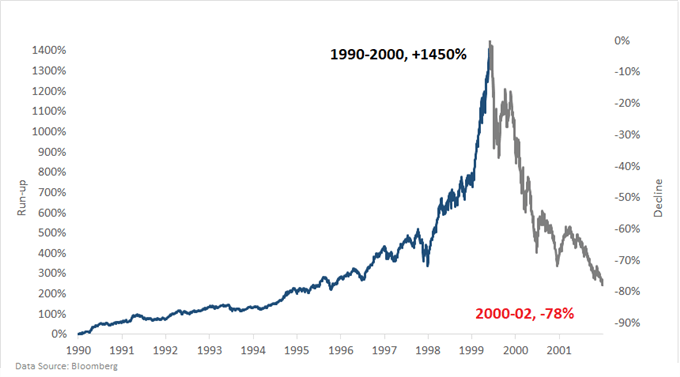
NASDAQ/Internet bubble 2000 (tech bubble burst)
The 1982-2000 bull market in the U.S. culminated with technology and internet stocks spiraling upward during the back-half of the ‘90s. The NASDAQ rose from 743 in the beginning of 1995 to a height of 5048 on March 10, 2000. In manic-like fashion, the index more than doubled during the final six months.
When the NASDAQ eventually troughed in September 2002, 78% of its value was wiped away, and most shares of internet companies saw their prices plummet by 95% or more (out of business). The then technology-heavy S&P 500 was cut nearly in half. The economy fell into a recession during 2001 after experiencing the longest run of growth in U.S. history, spanning 10 years.
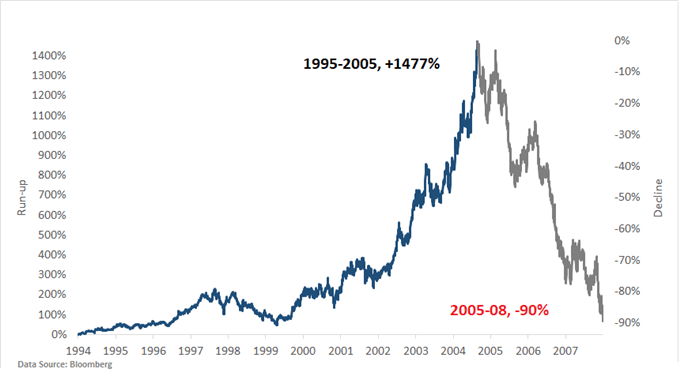
Housing market bubble 2007 (led to the financial crisis)
The housing and financials-driven bubble began in the ‘90s but really took the baton from technology and internet stocks after the stock market top of 2000. Real estate prices and the valuations of homebuilders continued to rise as low-interest rates fueled speculation in the real estate market.
The bubble seen in homebuilding stocks isn’t a direct reflection but rather a proxy for what was taking shape in the property market from the mid-90s up until the peak was reached.
The S&P 500 Homebuilding Total Return Index eventually fell by 90% from its peak in July 2005 to its trough in November 2008. It’s worth noting that the top in this sector came over two years before the top in the stock market, and in the end the bear market which began in housing forewarned the dangers which laid ahead for the broader economy and stock market.
Homebuilding stocks as a whole lost nearly 70% by late 2007 before the stock market topped. The result of the housing and stock market fall-out was the worst financial calamity since the Great Depression, earning the period from 2008 to 2009 the title of ‘The Great Financial Crisis’ (GFC).
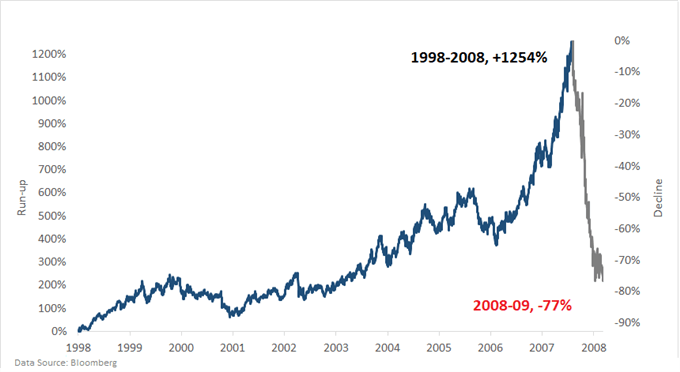
Crude oil 2008 (‘peak’ oil, collapsed during ‘GFC’)
The WTI crude oil bubble began in 1998 at a price of close to $10 per barrel, right around the cost of extracting it from the ground. The rise was persistent through 2007 before prices went vertical until the top in July 2008. The collapse was extremely fierce as the global economy crumbled during the Great Financial Crisis.
From July 2008 to January 2009 oil fell precipitously from $145 to a trough of $35, or 77% in just over six months’ time. This makes the oil collapse one of the most abrupt of all major historical market bubbles.
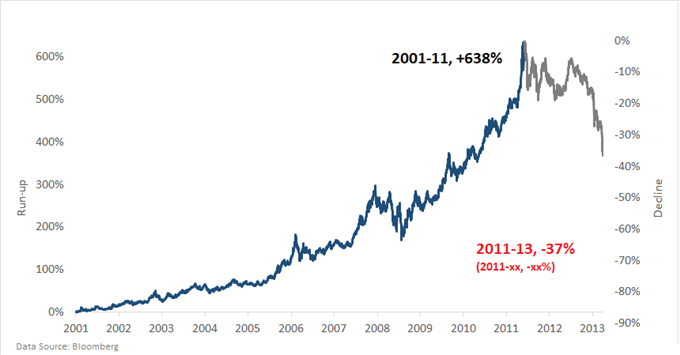
Precious metals 2011
This is the second of two major bubbles in the precious metals market, and while not as spectacular as the run-up to the 1980 top, it nevertheless still ranks as one of the bigger bubbles in the history of major markets. The bull market began in 1999 and picked up speed during the Great Financial Crisis before the end arrived in April 2011.
Silver
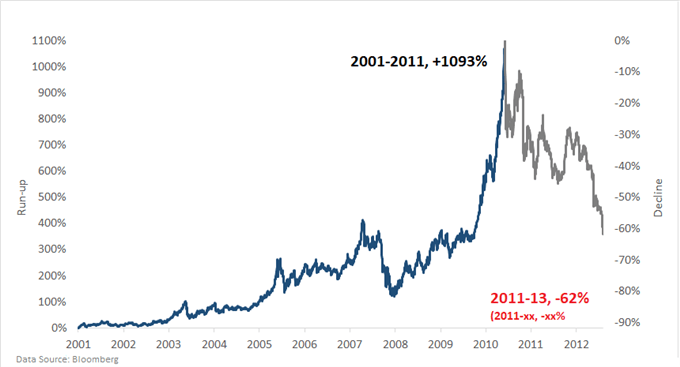
Gold peaked at a price of $1896 and silver at $43.25. By June 2013 gold was down by 35% and silver once again outshined the gold bubble on the downside by shedding 56% of its value. Both have traded lower since and at the time of this writing (December 2018) it is still unclear as to whether the bear market cycle is yet over.
Gold
NON-MAJOR MARKET BUBBLES
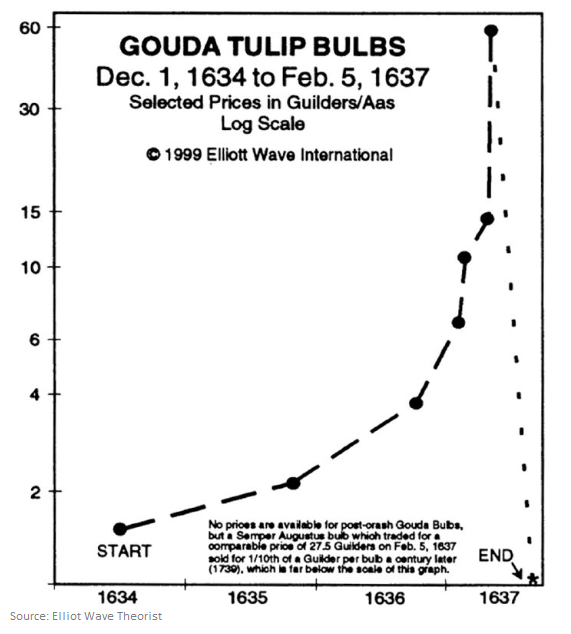
Tulip Mania (1637)
This is the first recorded speculative mania in history, and one of the most famous due not only its magnitude but ‘asset’ class. The price of traded tulips rose by an estimated 59-fold in about 16 months’ time before collapsing back to almost zero in just a few months.
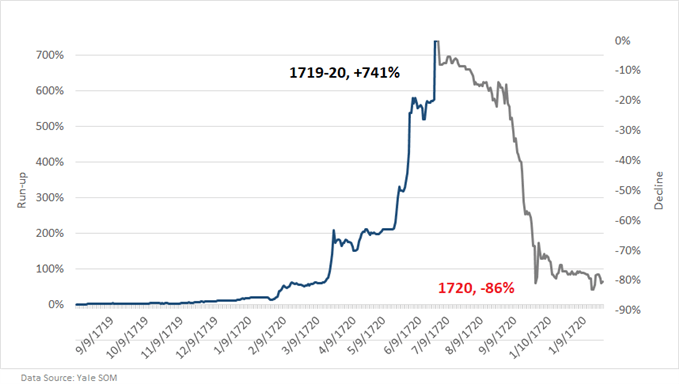
South Sea (1720)
The South Sea Company’s stock was one of several shipping companies in the early 1700s to attract massive amounts of investor capital. Another famous bubble in this sector took shape in shares of Mississippi Company. The South Sea bubble saw over a 700% increase in its price in just six months, and from its peak, in July 1720 the price declined by over 90% in only three months.
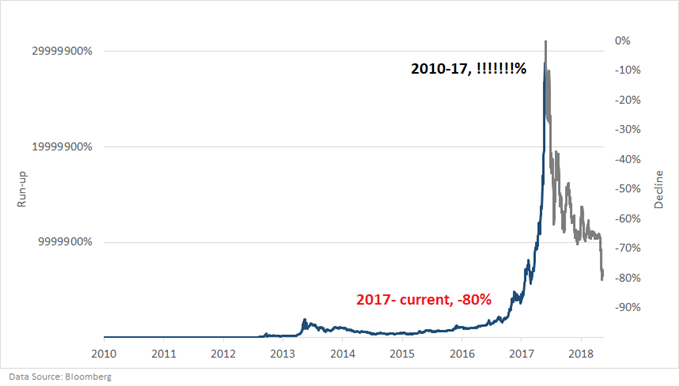
Bitcoin (Modern day tulips)
The cryptocurrency craze began in 2010 with Bitcoin and saw a staggering rise from under $1 to nearly $20k by December 2017. However, in mania-like fashion, the majority of those gains came in less than a year, with the price rising from around $700 in January 2017 to its final price of around $19600 (the exact price depends on the exchange where it was traded).
Without accurate prices from the Tulip days it’s hard to say with pin-point accuracy as to exactly by how much the Bitcoin bubble truly exceeded the Tulip mania, but by achieving literally millions of percent in returns from day one to the end (started at $0.06), does it really matter?
It was massive and when it comes to market speculation this is indeed a testament to human nature not changing one bit in nearly 400 years. The fallout at the time of this writing has been around 82% over the course of about a year.
NOTABLE FLASH-CRASHES
With market participants relying more and more on technology in the last 20 years or so, and the popularity of quantitative and algorithmic trading growing exponentially, flash-crashes have become a threat to financial market stability.
Even though technology and the people behind the machines take the blame, there is one commonality between the following examples of major flash-crashes – market duress. Not necessarily major duress, but enough that a significant imbalance can occur in a vacuum of liquidity.
A bevy of orders from one side of the market comes in and simultaneously the other side effectively steps away and just like that, you have a major air pocket. These air pockets, or liquidity vacuums, result in a sudden spike in price. And while they are only temporary the financial impact can be enormous for those caught in these unforeseen events.
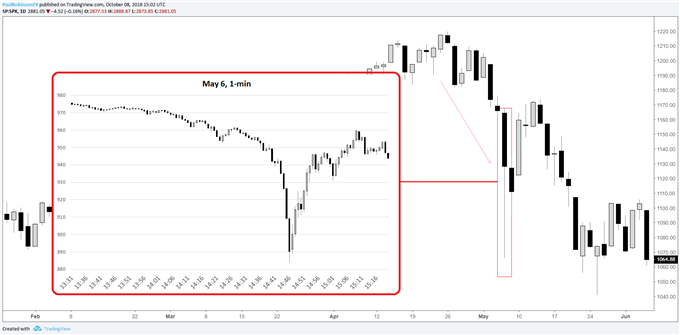
S&P 500 E-mini futures – May 6, 2010
This was the flash-crash which effectively put them on the map, given how large and impactful it was. On May 6 the stock market was under a bit of stress when suddenly the S&P 500 E-mini futures collapsed by over 6% in about seven minutes before fully erasing those losses in the 10-15 minutes following.
There was a ‘fall-guy’ for this one, a trader was accused and found guilty of placing large sell orders which would get canceled just before they would get filled. A strategy called ‘spoofing’. While the trader was found guilty of causing the flash-crash, these events don’t happen out of thin air. They occur when the market is already in a fragile state.
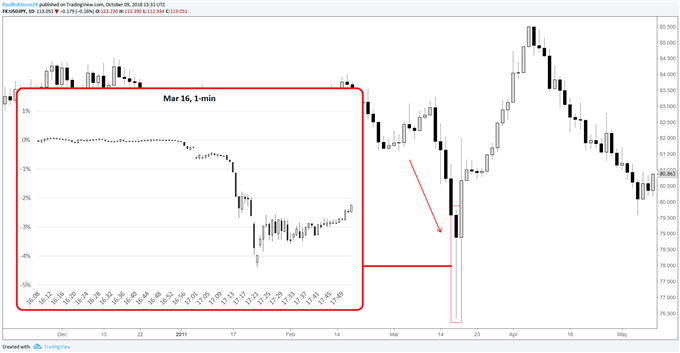
As mentioned before, loss of liquidity is a driving force here, and with regards to USD/JPY on March 16, 2011, this was especially the case. This event took place during the least liquid time of the day, just after the U.S. close. Not only was USD/JPY weak on the macro-front, trading at its worst levels on record, but more recently it had come under selling pressure in the wake of a massive earthquake and tsunami in Japan. Market conditions were in a fragile state when this particular liquidity-driven event hit. USD/JPY declined 3% in less than 10 minutes before recovering sharply.
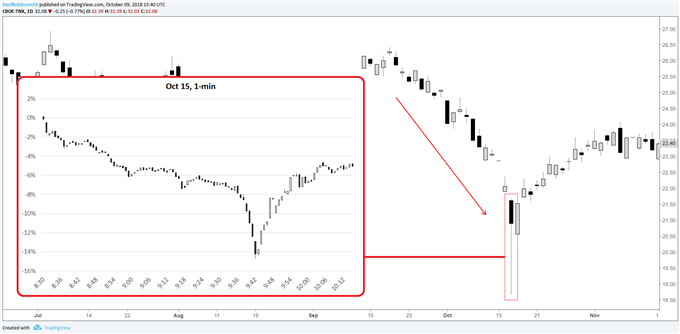
U.S. Treasuries – October 15, 2014
The treasury flash-crash on October 15 unfolded after a month-long decline in yields, playing not long after the stock market had opened for the day. The shot lower in yields (higher bond prices) lasted only a few minutes in typical flash-crash style and the price move was immediately wiped away in the minutes to follow.
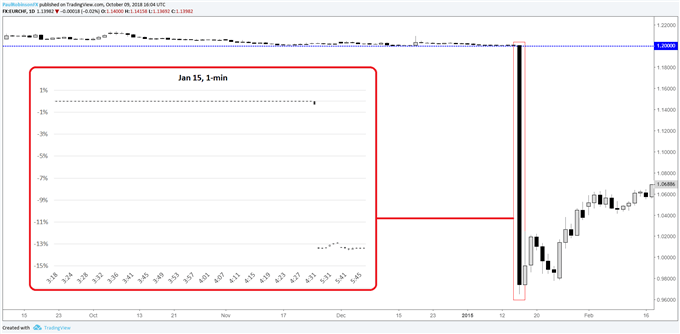
EURCHF – January 15, 2015
Of the examples we’ve looked at, this is the lone flash-crash which was sparked by an abrupt fundamental event. The Swiss National Bank (SNB) announced on January 15th that they were no longer supporting the Swiss Franc vs. the Euro at 1.20, causing the floor a large number of market participants were leaning against to collapse.
The drop was spectacular, as there were trades at some banks going off as low as 0.68. Since there is no official exchange where currencies trade the exact low isn’t known. But looking at the aggregate price move following the news, there was almost an instant decline of over 13%, with few trades executed in this air pocket. The gap took over 3 years to fill.
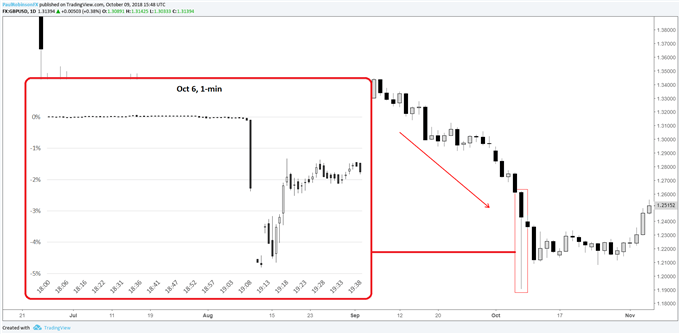
British Pound – October 6, 2016
The flash-crash in GBP/USD came about three months after ‘Brexit’ as the British currency continued to come under strong pressure. Similarly to USD/JPY, this event occurred during an illiquid time of the day, after the U.S. session during early Asian trade.
The spike lower was very extreme, taking no more than a couple of minutes for GBP/USD to decline nearly 5%. The recovery in the minutes after wasn’t as sharp as other flash-crash events, but a large portion of losses were recovered in the 20 minutes or so following.
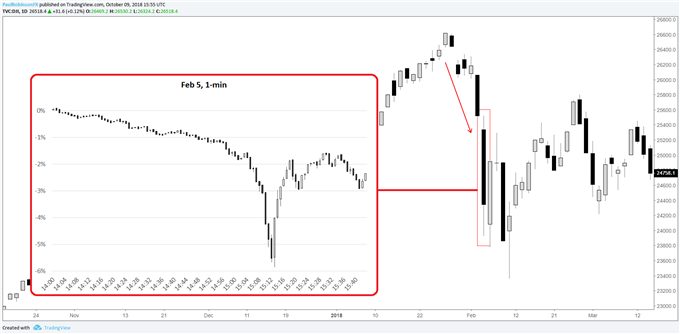
Dow futures – February 5, 2018
Index futures have become increasingly thin over the years, with stock market volumes also declining significantly. This has made index futures extra fragile. This one flew under the radar in some respects, but nevertheless, the sudden 4% drop in Dow futures in a 10-minutes window qualifies as a flash-crash. The recovery was equally as fierce.
The other major US indices also underwent similar price swings, but not to the same degree as the Dow. There was no ‘malfunction’ so to speak which caused this, but the market at the time was under short-term stress prior to the event.
TO CONCLUDE, GOING FORWARD...
Financial bubbles, crises, and flash-crashes aren’t an everyday occurrence but have been happening at a frequent enough rate in recent years that market participants should have familiarity with them.


