
3 Sentiment Ratios For The Pandemic Anniversary

As the harrowing date of the pandemic anniversary has come and gone, bond yield fears have continued to grip Wall Street. Even after last week's Fed meeting -- which saw Fed Chair Jerome Powell reinforce the central bank's dovish policy for at least two years -- the 10-year Treasury yield jumped 11 basis points to 1.75% promptly one day later, the highest level since January 2020.
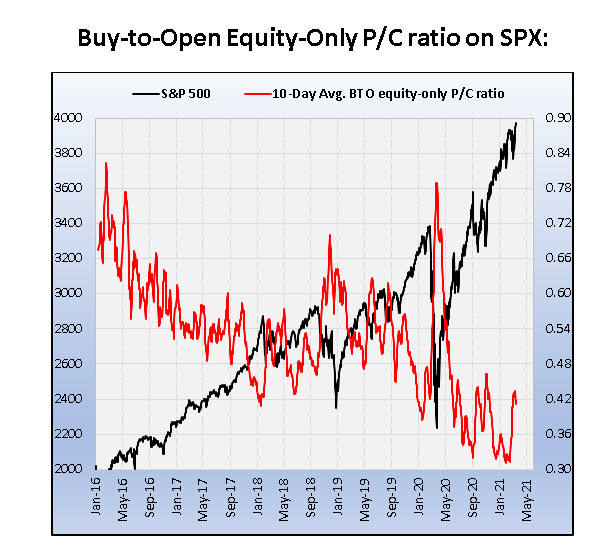
The push-and-pull of bond yields the last month has created a level of choppiness in tech, alternative energy, and other growth success stories. Here at Schaeffer's, one of the unique sentiment indicators we track is the 10-day equity-only buy-to-open put/call volume ratio -- compiled by our quantitative analysis team using data from the International Securities Exchange (ISE), Chicago Board Options Exchange (CBOE), and NASDAQ OMX PHLX (PHLX). This metric reflects the number of puts bought to open, relative to calls, on the three major options exchanges over a roughly two-week trading period.
By narrowing the focus to equity options, we eliminate a fair amount of hedging activity, which often centers around indexes and exchange-traded products -- thereby resulting in a truer sentiment read, where a skew toward puts can be generally considered as "bearish," and a preference for calls "bullish." Likewise, focusing on a 10-day time frame allows us to drill down on very recent option-buying activity, without getting bogged down by the "noise" of single-day data. And with short interest data released on delay every two weeks, we think this is a good indicator of real-time sentiment in terms of measuring how traders are playing the equity market.
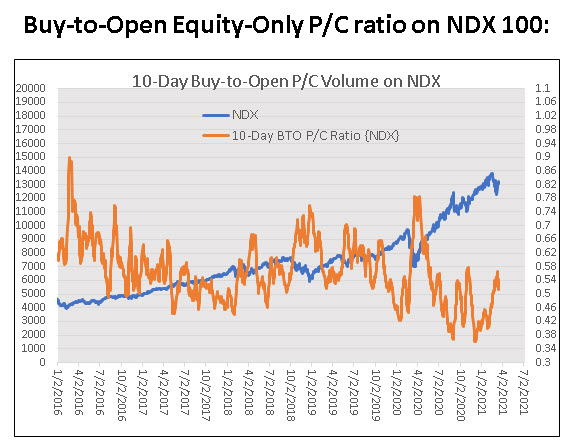
But given the "pandemicversary" it felt right to look back and see what these ratios are telling us now, versus what they told us on March 18, 2020, when the Cboe Volatility Index (VIX) spiked to 85.47. For the S&P 500 Index (SPX), the 10-day equity-only buy-to-open put/call volume ratio stood at 0.77. It closed on Thursday at 0.42, bouncing after probing new lows near 0.30. For the Nasdaq-100 Index (NDX), it stood at 0.76. Now, like the SPX ratio, at 0.51 it's bounced off lows and is moving higher toward its early November high coinciding with the 2020 U.S. Presidential election.
Here's where it gets interesting. For the VIX, the 10-day equity-only put/call volume ratio stood at 1.04 on March 19, 2020, one day after hitting its top. Now, its 0.70. The "fear gauge" tagged a new annual low of 18.95 earlier on Thursday, a far cry from those forays into 80, 12 months ago. But consider those p/c ratio levels for the VIX back in late October and early November. They clearly were much more responsive to an election than they were to the pandemic, or the bond yield drama we currently find ourselves in.

The context provided here isn't meant to stack up the bond yield panic we're currently wrangling with against the onset of the coronavirus pandemic of 2020. Instead, it should serve as a reminder that as long as speculators are increasingly negative -- and stacking up their bearish options bets accordingly -- the net effect will be a headwind for stocks that could hamper recovery attempts. Instead, it makes sense to wait for a rollover in the ratio, which would indicate that options players are backing down from climactic levels of pessimism, and pressure on stocks is lifting.
Disclaimer: Schaeffer's Investment Research ("SIR" or "we" or "us") is not registered as an investment adviser. SIR relies upon the "publishers' ...
more

