
18 Months Of Constant Recession Calls And No Recession...
We’ve been “in the late innings” of this economic expansion it seems for years. The last 18 months have featured almost daily recession predictions…..ALL have been wrong.
“Davidson” submits:
The market is providing a major teaching moment. Since the introduction of Harry Markowitz’s Modern Portfolio Theory (MPT), 1952, it has become the basis of all financial teaching and the basis of Financial Planning methods which are touted to make investing simple and reduce risk. MPT’s central tenet is that the investing future can be derived from past prices using mathematics. It is called the “Scientific Method’ because of the reliance on mathematics. Markets produce trillions of data points every month. It should not surprise anyone that believing one should be able to solve the ‘market puzzle’ if one only applies the right mathematical analysis. Despite the billions spent, the hundreds of thousands of Ph.D.’s awarded and implementation of high-speed computers and algorithms, no solution has ever been found. There are underlying facts that have been ignored which make it clear that there has never been a set solution possible to markets.
Markets reflect our perception of the value of things based on our current experience and knowledge. Prices are based on market psychology which evolves every day as we learn more about our surroundings and value what we believe things are worth. Every day’s pricing represents our accumulated standard of living history to that point in time. Any significant innovation or discovery can cause subsequent shifts in what we believe things are worth. We saw this dramatically when Steve Jobs introduced the iPhone in 2007 and when Gilead cured Hepatitis C disease in 2013. Many such lesser-noticed events occur every year which shift our perceptions daily. Market prices adjust to our accumulated history-making every day being a little different. Mathematics based on prices cannot capture this because the market psychology that determined prices in the past is not the same determining prices today. Mathematics requires that the basis of value not shift over time. That the basis is always shifting makes a mathematical analysis of this data useless. Mathematics has never provided the solution many believed possible. The continued belief that mathematics can anticipate future pricing when it has never been successful in the past is decidedly unscientific.
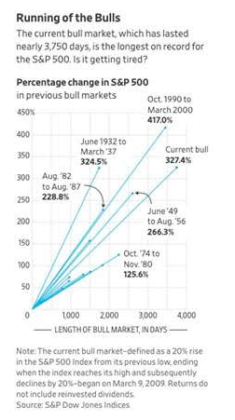
Yet, much of current investor thinking is based on historic price trends repeating with mathematical precision. There have been many articles the past 18mos that ‘it was time’ for a market peak as if market cycles worked off of an internal ‘egg timer’. Two recent pieces worth reading come from Jason Zweig and Howard Marks.
Jason Zweig-“What Yogi Berra Would Have Said About This Bull Market”
Market cycles tend to last for years, and major turning points are few. So how do we know if stocks are nearing a turning point?
(Click on image to enlarge)
Howard Marks -” This Time It’s Different”
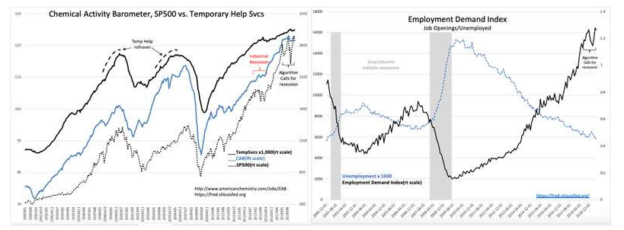
If one reads market history, markets reflect the history of the market conditions of the time, i.e. policies, business practices, geopolitics, and market psychology. Every market cycle differs from its predecessors. Markets never repeat. The investing analogy which is apt is that investing is like reading an epic novel as it is being written. One needs to understand value creation and the market psychology response that translates this into market prices. It is when significant discrepancies exist between value creation and market psychology that investment opportunities occur. A significant opportunity is in today’s marketplace with algorithms signaling recession the last 18mos. Algorithms caused 3 significant dips in the SP500 since Jan 2018 while economic and business data signaled continued growth. Algorithms are designed to respond to market prices and news input. The immediate buying or selling of shares based on whether a news report was positive or negative with regard to expectations are algorithmic activity. Traders use algorithms to trade on information believing the first-to-market will out-perform competitors. While Momentum Investors act on each surprise report as the beginning of a new trend, economic data collection is never precise and reports are typically revised as data trickles in. This makes investing on any single report highly questionable. Economic and business trends are always choppy. They require 12mos of data before a change in trend can be identified. The recession predictions the past 18mos are not supported by multiple economic indicators rising to new cycle highs.
The last 18mos make this one of the longest periods in our history during which pessimism has prevailed against positive economic momentum. 18mos is the length of the typical recession. This time no recession occurred. The last time we had such a disparity between investor psychology and economic trends was 9/11. History shows the economy turned higher the month of 9/11 but equity markets fell for the next 12mos before investors finally responded to economic trends. Current market psychology differs widely from economic trends. This has always proven to have been a good investment opportunity in the past.
(Click on image to enlarge)
How the current cycle is different from past markets requires more space than one note can outline. A few of these differences are listed:
1) Emerging Market (EM) assets have been monetized with capital shifting to Western assets, i.e. real estate and Sovereign debt. This has caused historical non-economic rates of returns as EM investors are more interested in seeking safety-of-capital away from their native confiscatory governments and are less interested in returns-of-capital. Relatively higher Western currency values with record high real estate prices in Western cities and non-economic rates of returns in Sovereign debt has been the result. In several instances, this has caused negative bond yields. A condition unique during a global economic expansion.
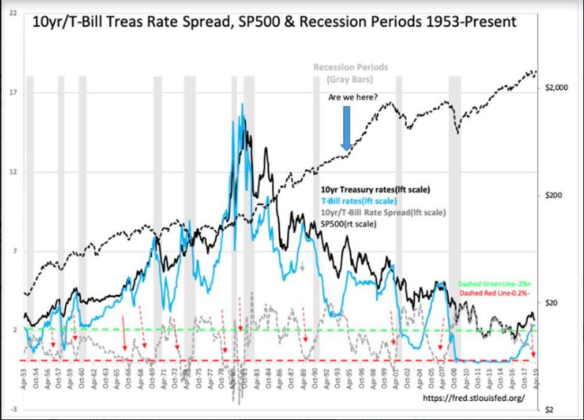
2) In the US, a high level of regulation from previous administrations has been reversed with lower taxation. Dodd-Frank regulation on smaller banks is in the process of being reduced to permit return to historical mortgage issuance after a long period of shortage of Single-Family Homes. Improved mortgage availability could add 600Bil+ to US GDP annually. In 1995 a similar liquidity event occurred which boosted equity prices the following 5yrs. In the chart below, note the BLUE ARROW with the question, “Are we here?”
3) The US is recasting tariffs responsible for trade imbalances with the goal of reducing tariffs globally. Success in some areas has stimulated US manufacturing and additional economic growth should occur if the intiatives reach their overall targets. This would make the US more competitive than it has been in 70yrs should the targets be achieved.
4) The US is using economic sanctions to reduce the global impact of non-Democratic governments. The use of the military which has in the past proven inflationary has been limited. The many predictions for higher inflation have not proved correct. This may yet change but many have been surprised at how steady inflation has been around 2%. Some are predicting inflation to drop towards 1.5%. Lower inflation justifies higher pricing on earnings per share returns. The best one can do is to watch the data evolve and respond appropriately.
An impact of EM capital transfer to the Western capital base has been the distortion of rates such that the nearly 70yr history of yield curve inversion which feeds algorithms is no longer useful. The history used by algorithms to generate a market sell signals has been when the rate spread of 3mo and 10yr Treasuries fell below 0.20%. Such a narrowing of this rate spread had been a good proxy of bank lending activity. Below 0.20% had signaled pending market tops and pending recessions in the past. Such a signal also reflected market psychology turning towards panic. This time it reflects EM capital flowing into 10yr Treasuries driving rates lower as investors exit China, Turkey, Venezuela, Russia, Iran, and even Europe as governments interfere with capital allocation decisions. The flow of capital has accelerated as the US seeks lower global tariffs. The yield curve inverted as the rate spread fell to (minus) -0.15%. The market correction Oct 2018-Dec 2018 had many identifying the yield curve as their reason to sell stocks despite the continued uptrends in key economic trends.
(Click on image to enlarge)
Every market cycle differs from past cycles. There remains an over-reliance on the mathematical tools developed the past 70yrs which have never proved useful. They are even more useless today with foreign markets having developed sufficient size to impact global capital flows. Understanding markets requires a combination of understanding psychology, global political trends, individual corporate management teams, how certain government structures favor capital over others along with anything that appears significant. One needs to monitor this complex package daily and identify the economic activity which has been under-priced by market psychology. It is indeed much like reading an epic novel as the story is written with the goal of out-guessing the next shift in market psychology.
What has held over time is that good business returns have always been recognized eventually by higher market prices. With the pessimism of the past 18mos, the gap between market psychology and economic trends continues to widen. Investing is not the simple process promoted by Financial Planning and Modern Portfolio Theory.
Disclosure: The information in this blog post represents my own opinions and does not contain a recommendation for any particular security or investment. I or my affiliates may hold positions or ...
more

