
Bitcoin Stabilizes After 6 Daily Candles Fail To Break Low
Bitcoin (BTC/USD) has not made a lower low. Price action seems to be respecting the 61.8% Fibonacci retracement level as expected.
But the main question now is: will price action be able to show a bullish reversal? Let’s review the key decision zones and Elliott Wave patterns.
Price Charts and Technical Analysis
(Click on image to enlarge)

The BTC/USD is testing the 21 ema zone of the weekly chart only for the 2nd time since the uptrend started. As mentioned in our article “Bitcoin 2021 vs Bitcoin 2017: How The Bull Trends Are Similar and Different”, the uptrend in 2017 on the other hand had 6x retests and bounces in this zone, which means that an uptrend is still very probable.
The BTC/USD is also testing the support of the long-term moving averages (144-233 emas). A second retest of the 61.8% Fibonacci level is possible:
- A bullish bounce above the previous low could confirm the current wave A (grey) within wave 4 (pink) pattern that is expected.
- A bearish breakout places the uptrend and this Elliott Wave analysis on hold (orange button).
- The bearish ABC (orange) pattern is probably not completing wave 4 (pink) because usually waves 4 are lengthy and complex.
- Therefore, a larger bearish ABC (grey) pattern is expected before completing wave 4 (pink). A bullish ABC (orange) in wave B (grey) is possible.
- Six daily candlesticks were unable to break below the previous low which is making a bullish bounce more likely from a time pattern point of view.
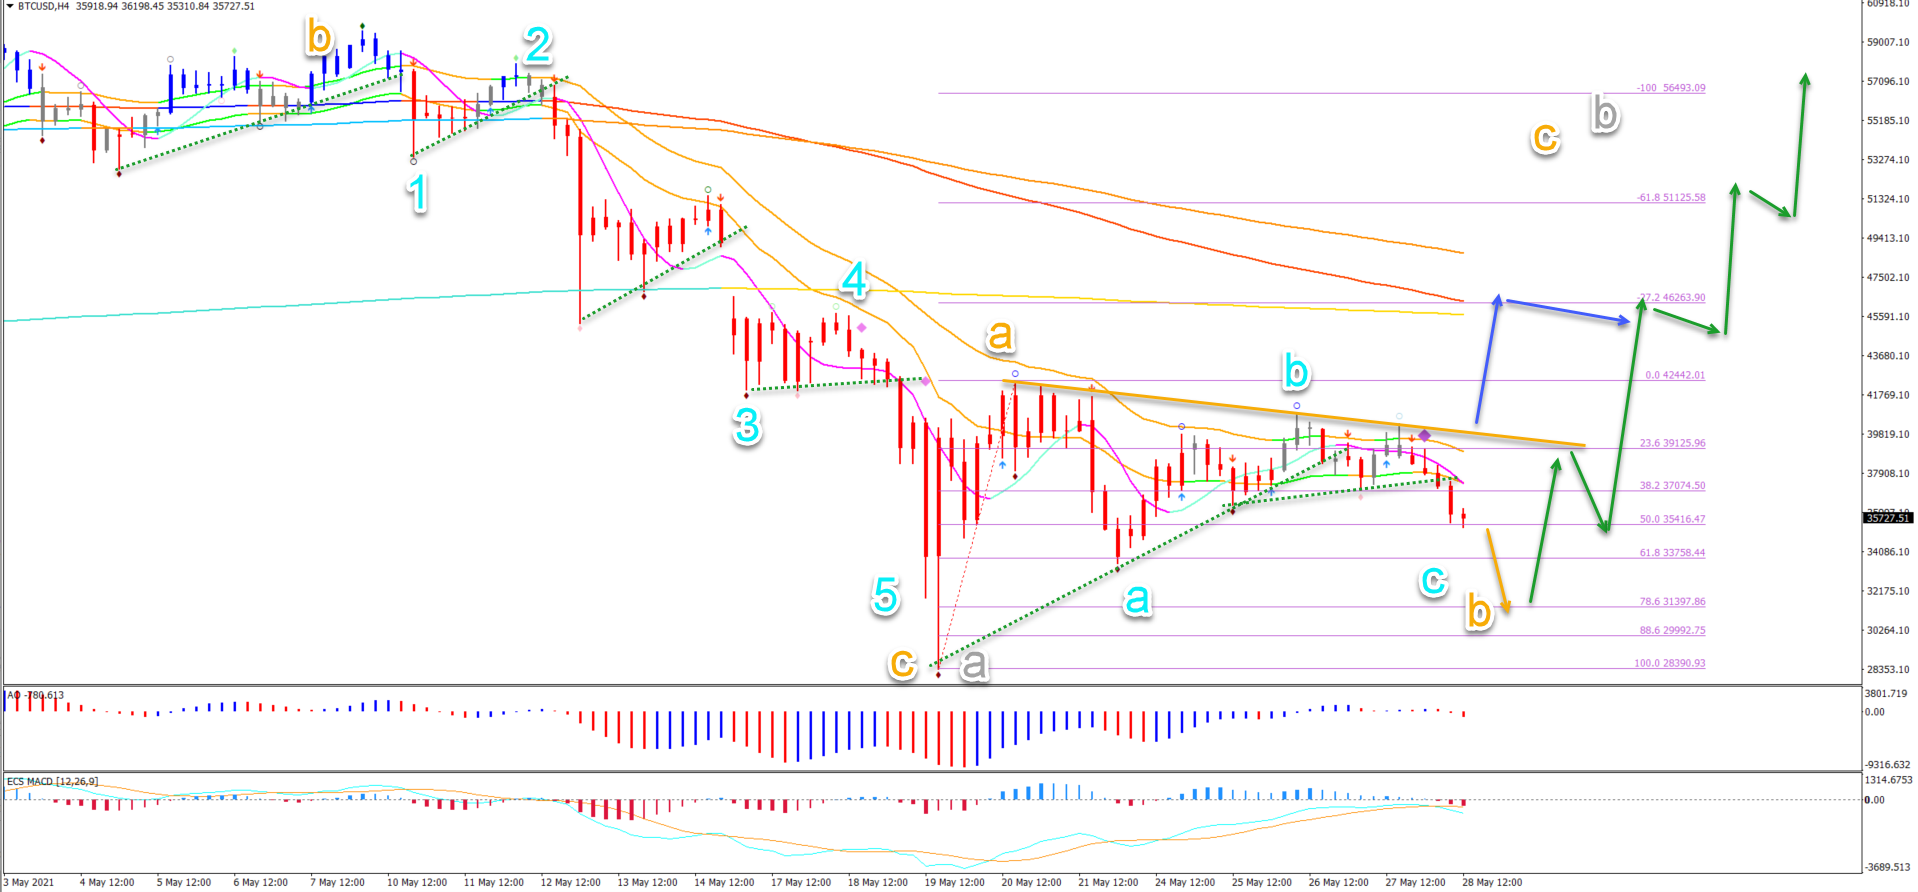
On the 4 hour chart, price action was unable to break above the 21 ema resistance zone and resistance trend line (orange):
- Price action broke below the support trend lines (dotted green), which is indicating a bearish push.
- Bitcoin could be building a bearish BAC (blue) in wave B (orange).
- Price action could reach the 78.6% Fibonacci retracement support level.
- The 78.6% Fib is expected to act as support and potential bounce (green arrows).
- A bullish breakout above the 21 ema zone could confirm the bullish reversal.
- An immediate breakout above the 21 ema zone without hitting the 78.6% Fibonacci could do the same (blue arrow).
(Click on image to enlarge)
Disclaimer: CFDs are complex instruments and come with a high risk of losing money rapidly due to leverage. On average around 80% of retail investor accounts loose money when trading with high ...
more

