
Bitcoin Price Forecast: Coinbase IPO May Fuel BTC's Push To Record Highs
As mentioned in previous reports, the gradual adoption of Bitcoin, and cryptocurrencies in general, by several well-known financial institutions and companies has painted a rather bullish longer-term outlook for the digital asset space. The impending initial public offering of the cryptocurrency exchange Coinbase will probably provide further validation to the digital asset space.

Image Source: Pexels
The 9-year old company has been valued at about $100 billion, which is more than the combined value of the New York Stock Exchange and Nasdaq Stock Market. This move into the public sphere by one of the world’s most prominent crypto exchanges could ignite further gains for Bitcoin in the near term, and pave the way for the anti-fiat asset to climb to fresh record highs.
Bitcoin (BTC/USD) Weekly Chart - Bearish RSI Divergence Points To Uptrend Exhaustion
(Click on image to enlarge)
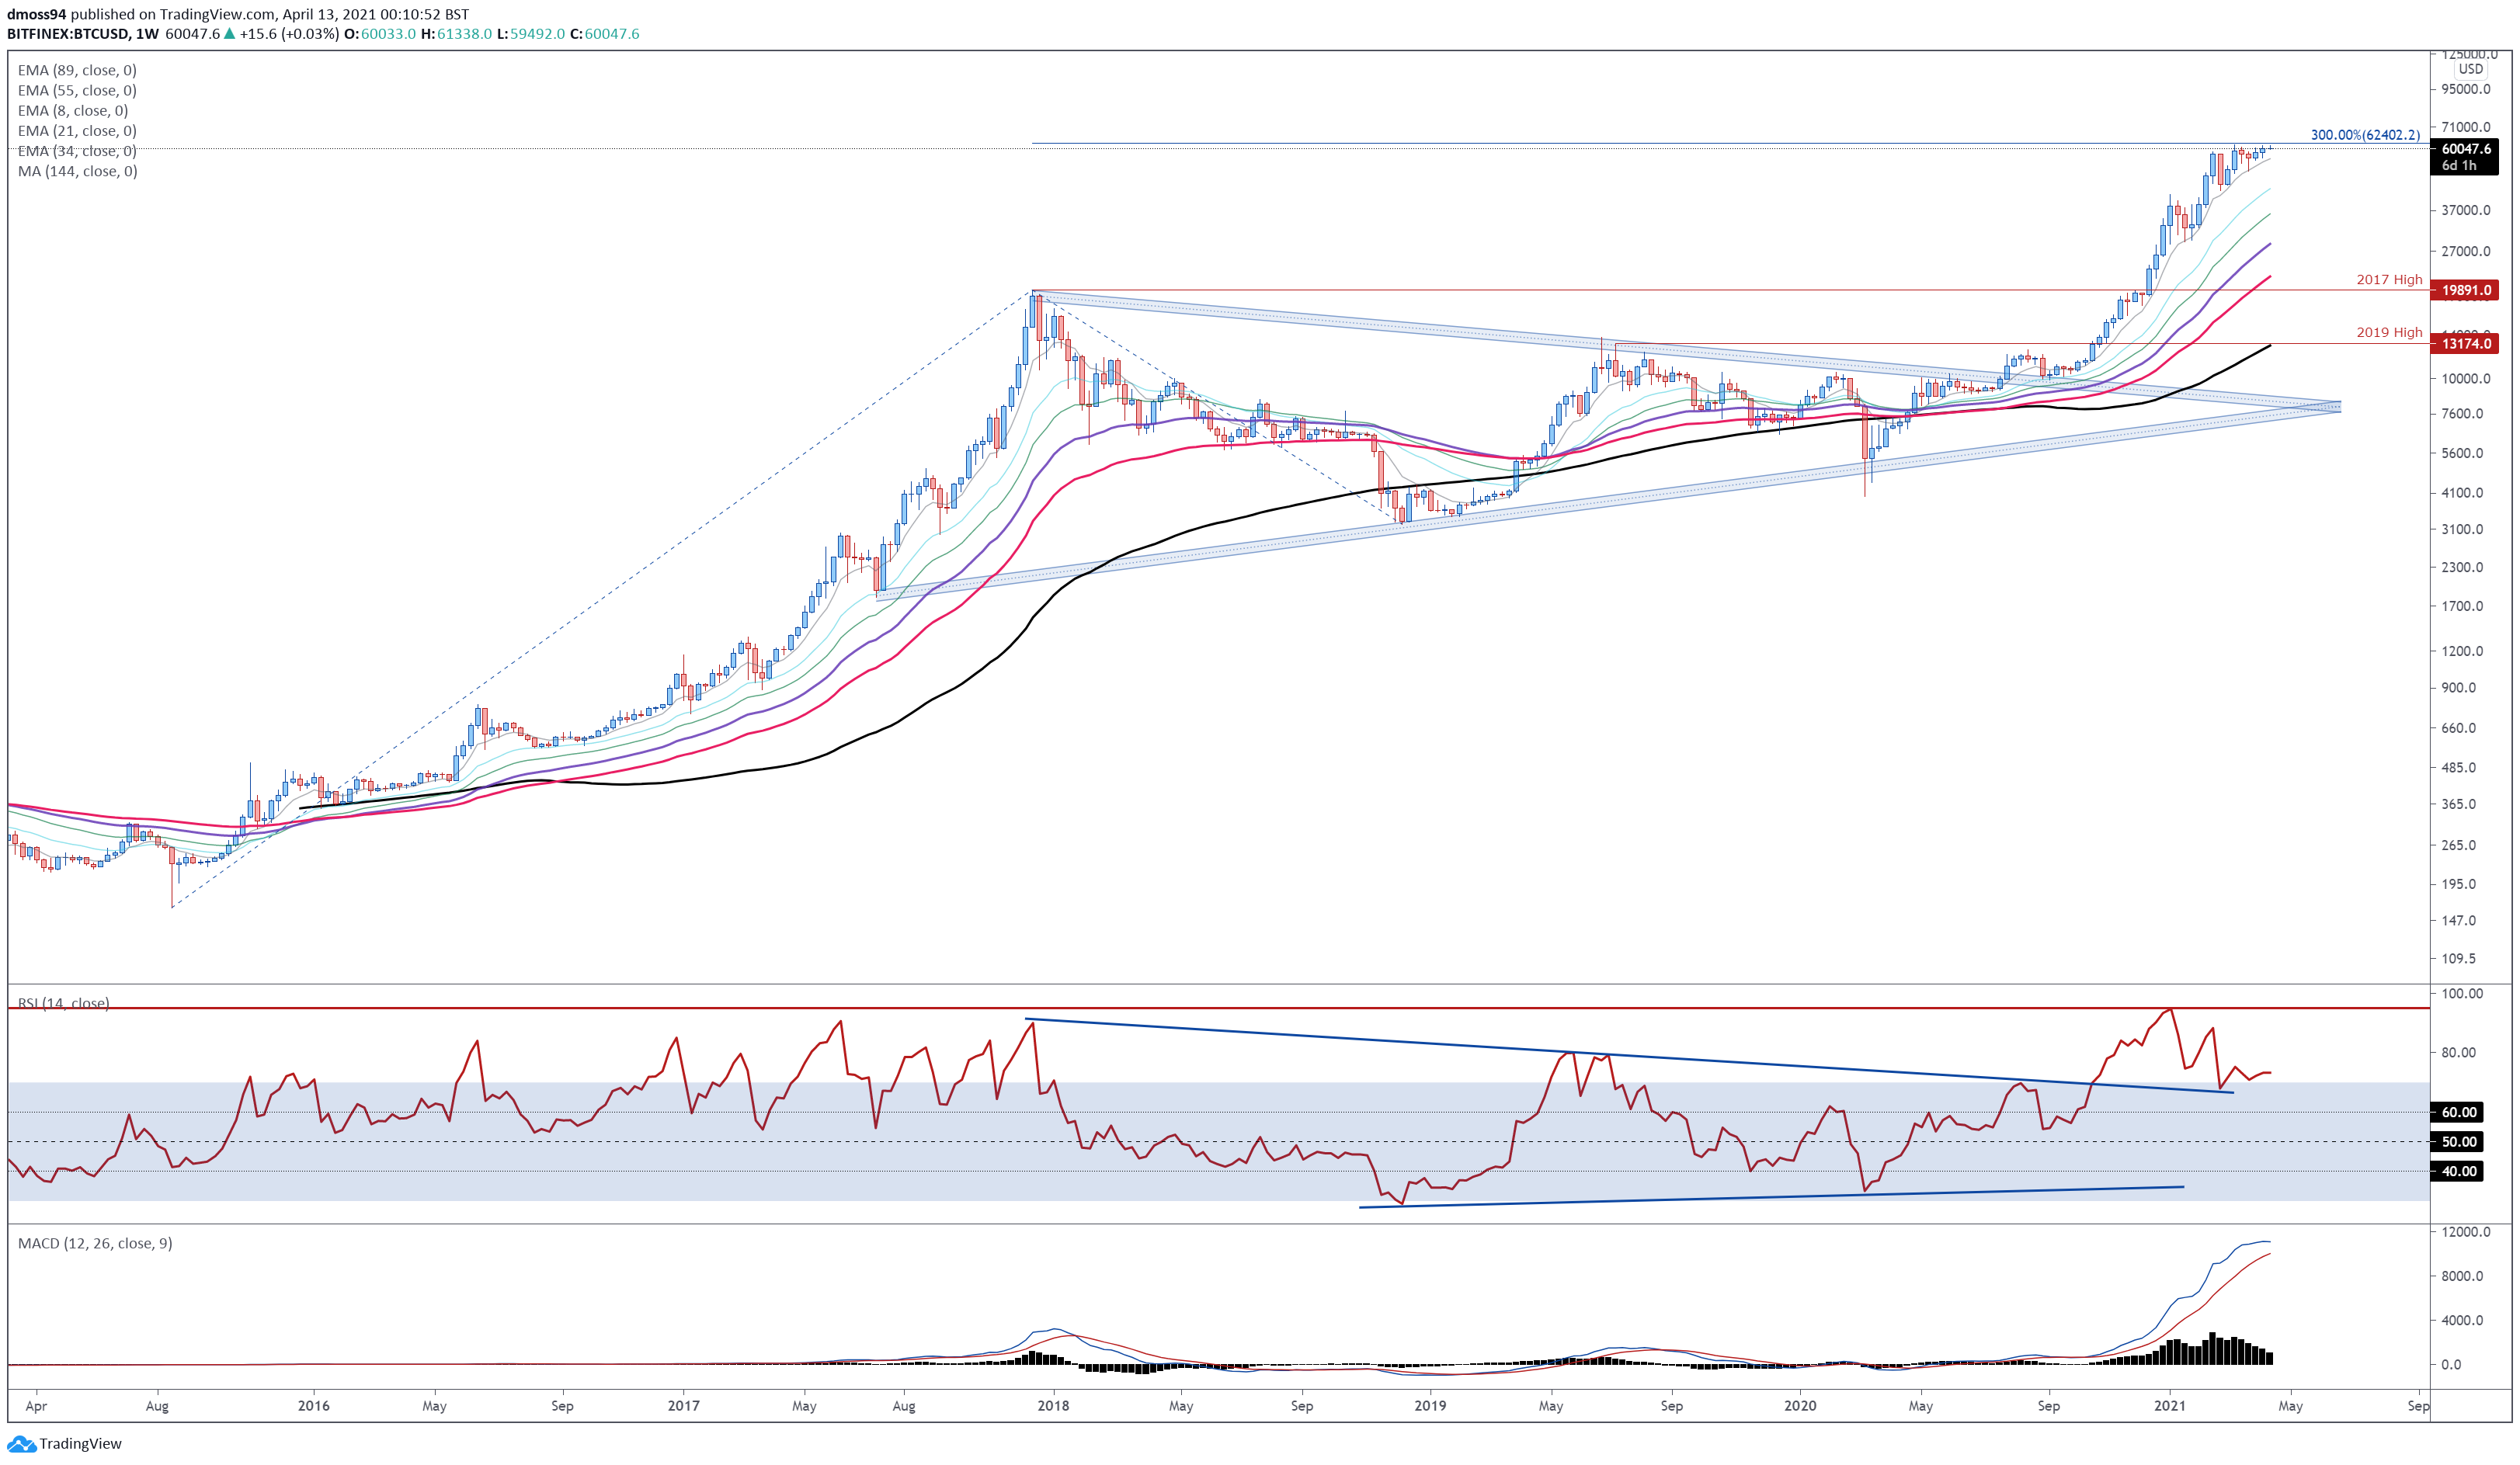
Chart prepared by Daniel Moss, created with Tradingview
The weekly chart suggests that Bitcoin could be at risk of a short-term pullback, as prices struggle to breach the 300% Fibonacci extension (62402) of the August 2015 to December 2017 uptrend.
Indeed, bearish RSI divergence, in combination with a possible bearish crossover taking shape on the MACD indicator, hints that the surge from the March 2020 lows may be running out of steam.
Failing to gain a firm foothold above 62,400 on a weekly close basis could open the door for sellers to drive the popular cryptocurrency lower, with a break below the 8-EMA (55443) potentially triggering a pullback to the March low (45100).
On the other hand, a convincing push above 62,400 likely signals the resumption of the primary uptrend and brings the psychologically imposing 70,000 handle into play.
Bitcoin (BTC/USD) Daily Chart - Consolidating Below Key Resistance
(Click on image to enlarge)
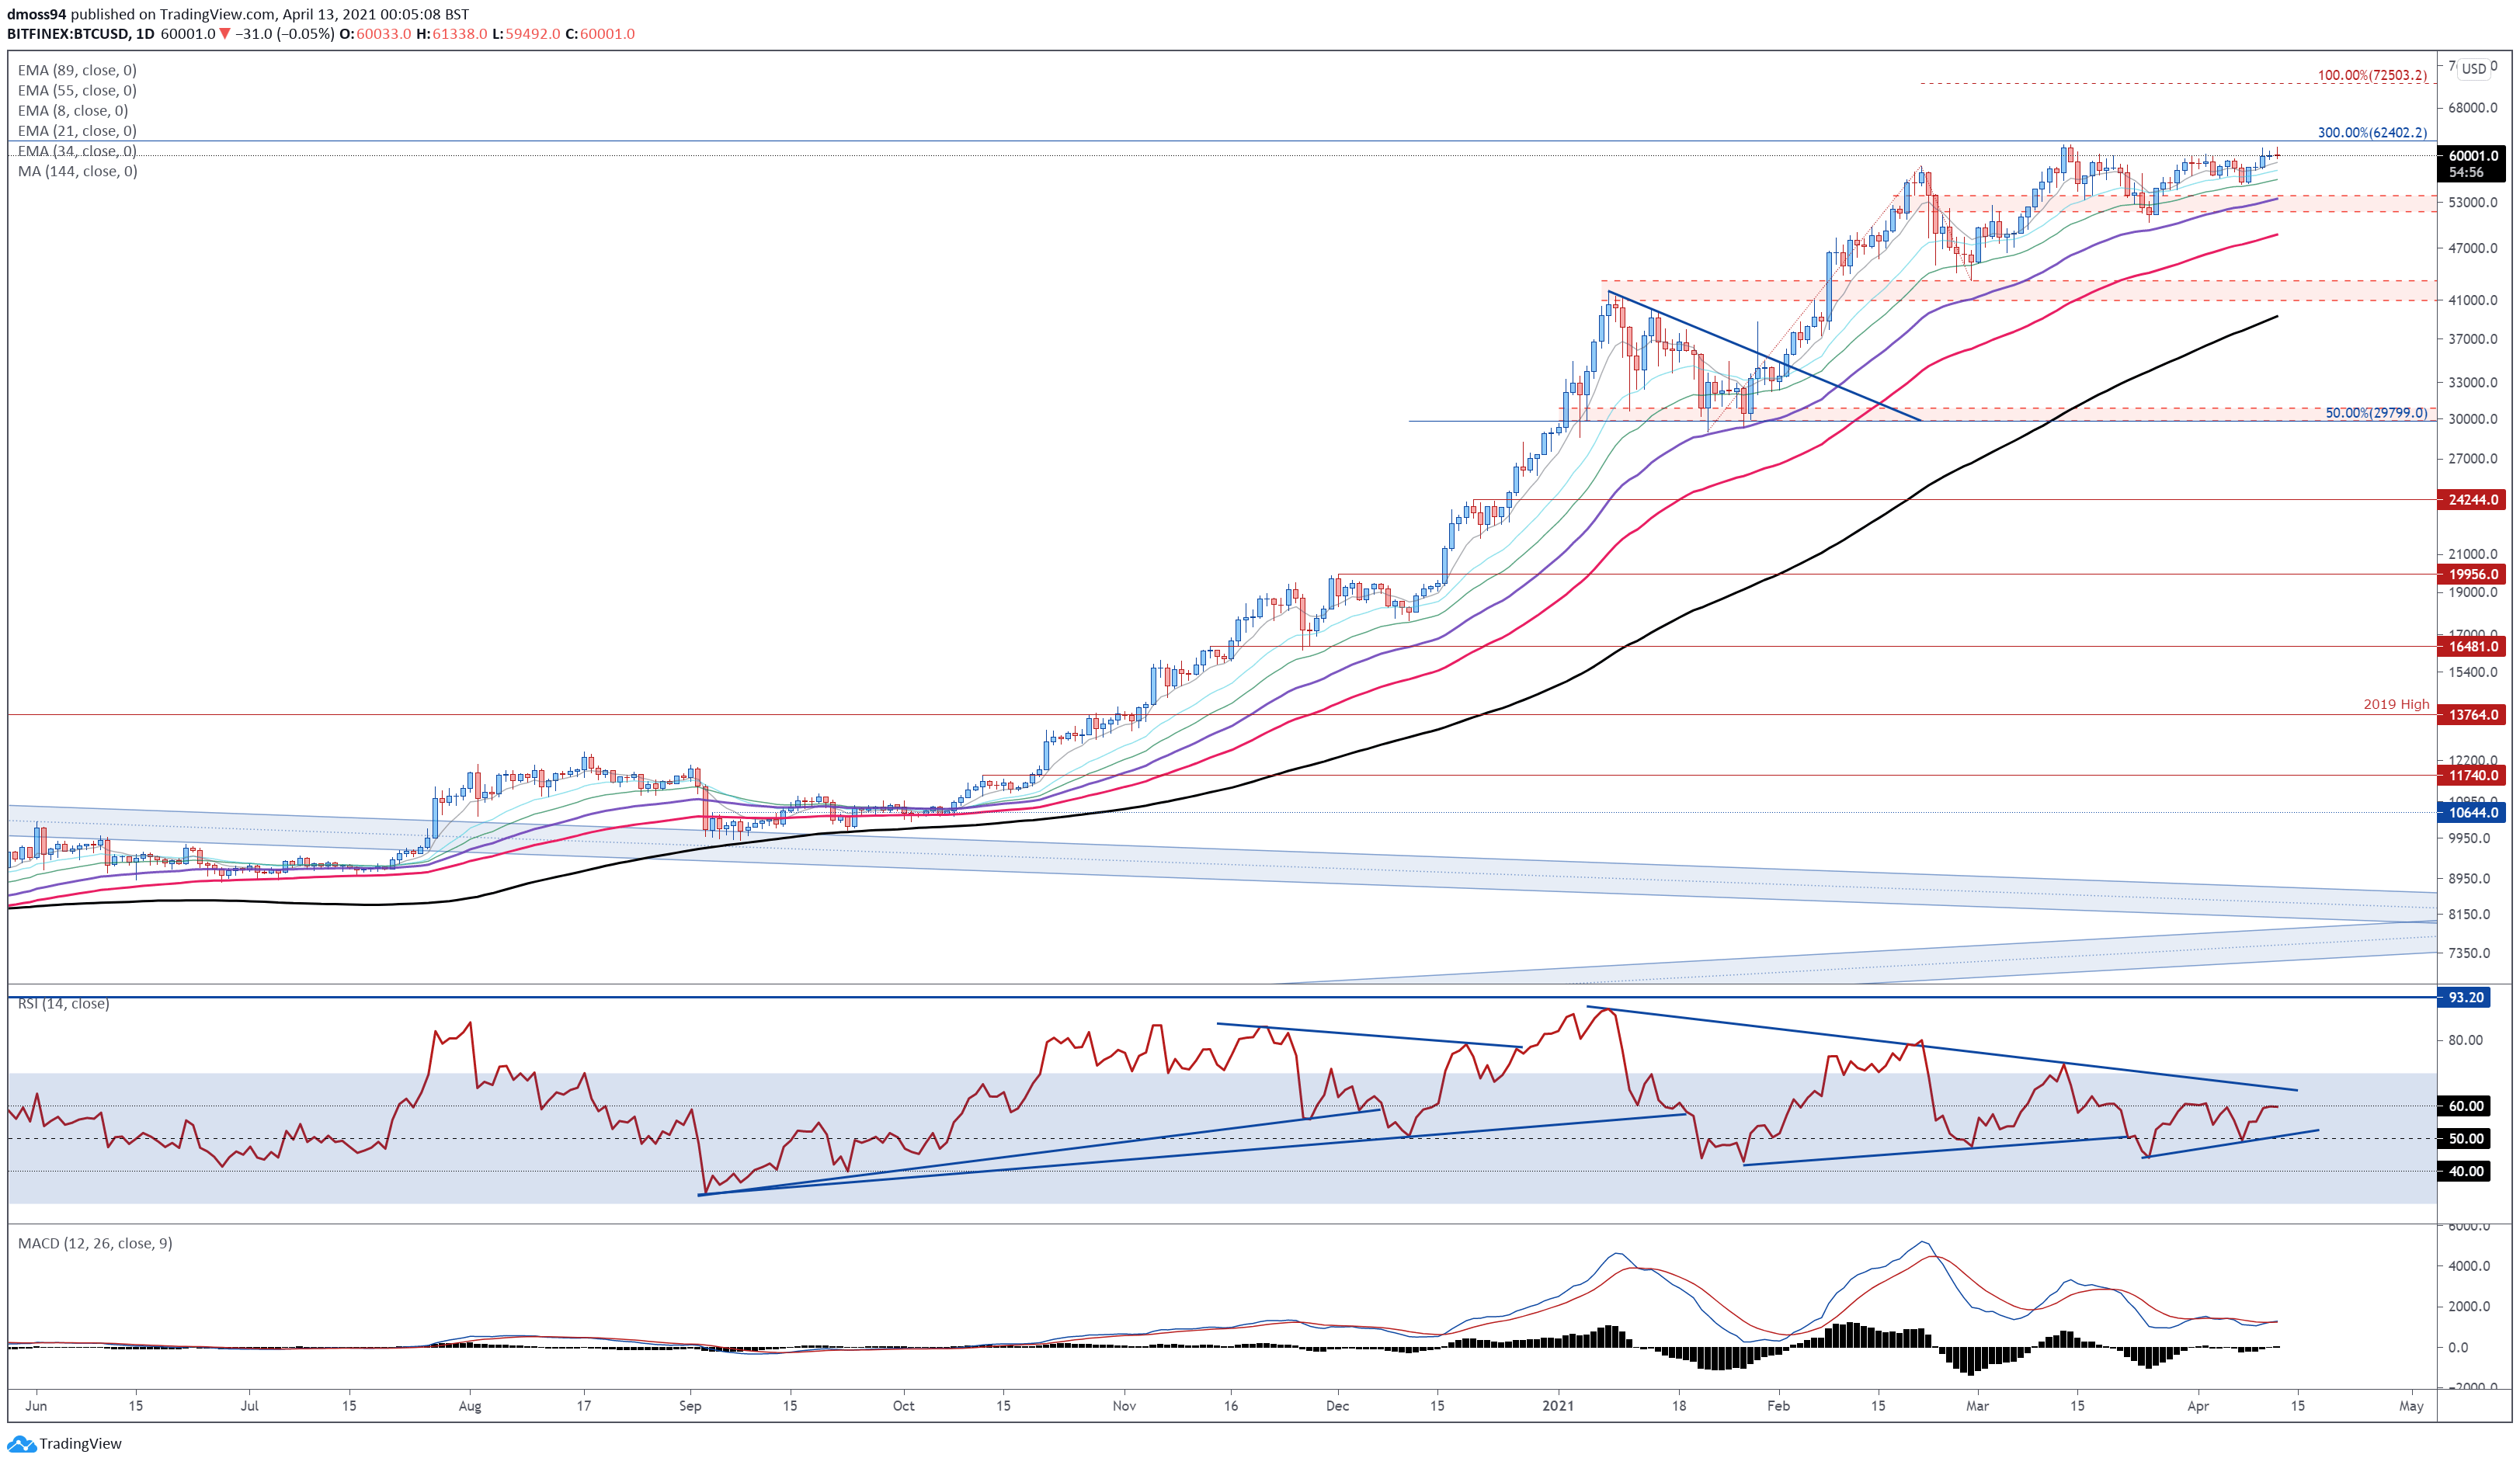
Chart prepared by Daniel Moss, created with Tradingview
The daily chart also hints at a level of buying fatigue, as a Shooting Star and Doji candle form just shy of the record high set in February (61699).
Significant bearish RSI divergence, and the notable plateauing of all three short-term moving averages, suggests that bullish momentum is fading.
Nevertheless, bullish MA stacking and the MACD continuing to track above its neutral midpoint, indicates that the path of least resistance is higher.
Remaining constructively perched above 60,000 would probably allow buyers to continue probing the yearly high (61699), with a daily close above needed to signal the resumption of the primary uptrend and carve a path for price to challenge the 100% Fibonacci (72503).
However, if 60,000 gives way, a swift decline back towards the trend-defining 55-EMA (53567) could be in the offing.


