
Bitcoin Price Analysis: BTCUSD Breakout Bursts Through Big Resistance
With the US Dollar continuing to sell-off, a number of markets remain of interest. Gold may be gearing up for another breakout at some point in the next couple of weeks but, by and large, that loud bullish theme from this summer remains on hold. One area that hasn’t been restrained of recent, however, is Bitcoin, which broke through a big batch of resistance earlier this week to push up to a fresh yearly high.
BITCOIN DAILY PRICE CHART
(Click on image to enlarge)
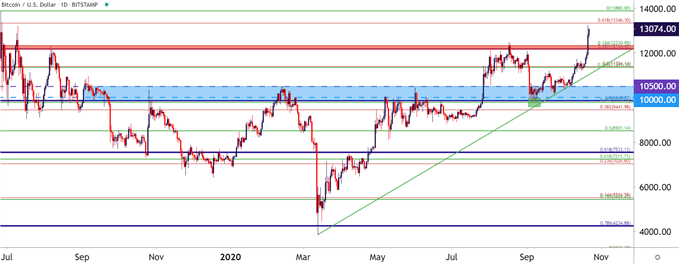
Chart prepared by James Stanley; Bitcoin on Tradingview
THE BITCOIN RALLY CONTINUES TO DRIVE
I had last looked at Bitcoin in May of this year, just as the cryptocurrency was re-engaging with the 10k psychological level. And as I’d shared then, there were similar drives of attraction to Bitcoin as what had showed around Gold or other USD-denominated assets. With one of the few clear drivers from the first-half of this year, it looked as though the US response to the coronavirus was going to entail more and more stimulus. This could serve to weaken the Dollar and, by nature, that weaker USD could increase the value of assets that were denominated in the currency, such as Gold or, Bitcoin.
That theme in Gold showed very loudly throughout this summer as the yellow metal pushed up to a fresh all-time high. But in Bitcoin, the move was a bit more delayed as the cryptocurrency battled through a pre-existing network of support and resistance levels.
In mid-August, just after Gold had topped, Bitcoin found resistance at a big area of confluent resistance on the chart. This spans from around 12,166 up to 12,330, both levels produced by longer-term Fibonacci retracements; and this area helped to stop bulls dead in their tracks in mid-August.
At that point, prices in Bitcoin simply tilted-back down to another key area on the chart, around the 10k marker. Another couple of Fibonacci levels around that 10k marker helped to hold the lows, and buyers got back into the driver’s seat a couple of weeks ago, helping to push up to this fresh yearly high.
BITCOIN EIGHT-HOUR PRICE CHART
(Click on image to enlarge)
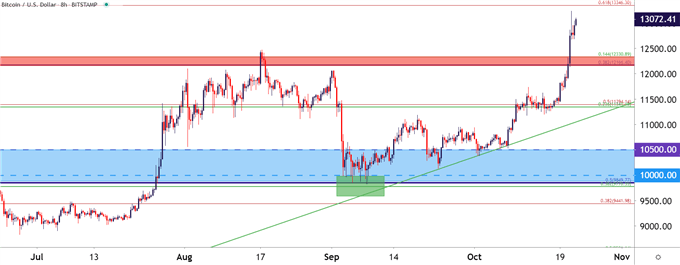
Chart prepared by James Stanley; Bitcoin on Tradingview
BITCOIN STRATEGY NEAR-TERM
While fresh highs may beget more fresh highs, it also produces complications for those looking to take-on exposure, particularly from a risk management perspective. At this point, given how long the breakout has been in-play, traders may want to instead exercise a bit of patience when looking to onload bullish Bitcoin exposure.
One area of particular interest for possible support is that same zone of resistance that turned around the August advance. The August high is at 12,473, and just below that we have the confluent zone coming from two different longer-term Fibonacci levels, plotted from 12,166-12,330. This could function as a type of ‘s2’ zone of possible support for pullback themes. Below that, a third zone can be followed around the 11,341-11,394 area on the Bitcoin chart.
BITCOIN FOUR-HOUR PRICE CHART
(Click on image to enlarge)
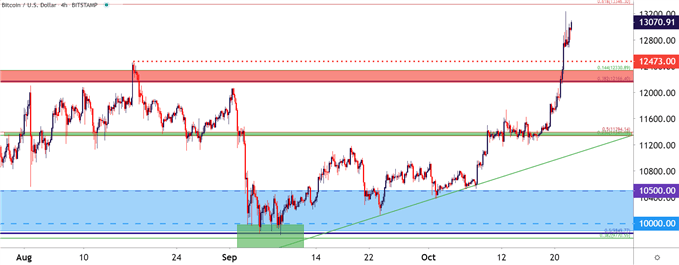
Chart prepared by James Stanley; Bitcoin on Tradingview
Disclosure: See the full disclosure for DailyFX here.


