
Bitcoin; OMG Could It Really Reach $250,000 Level?
(Click on image to enlarge)
Can anything stop Bitcoin’s rising tide? We may know soon.
Bitcoin’s recent run-up to over 60,000 is testing its 2020 highs and a key Fibonacci price resistance level. This area looks to be an important time/price juncture. Let’s dig in.
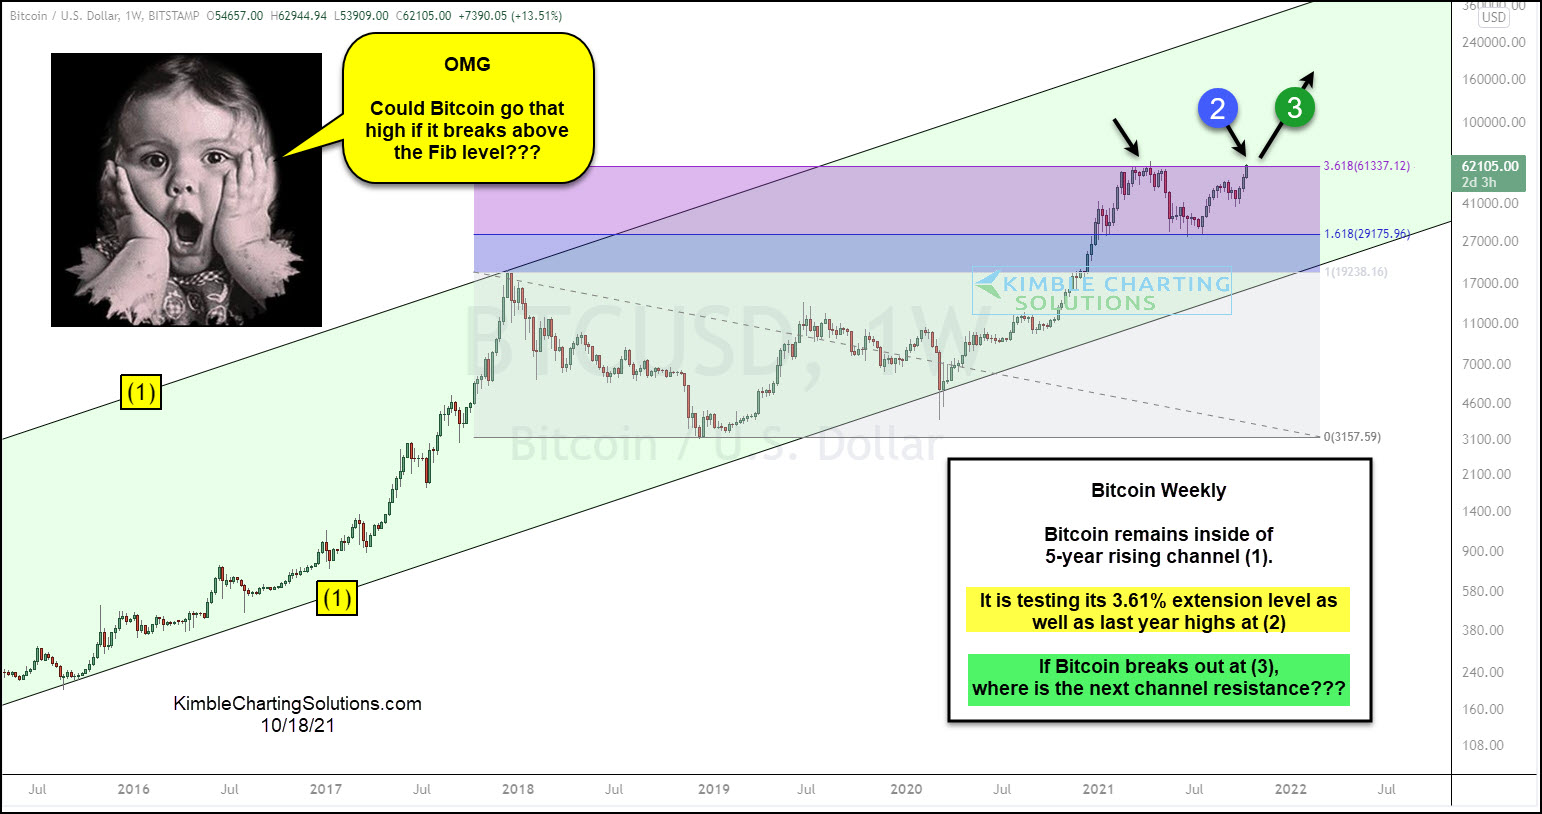
Today’s chart is a “weekly” chart for Bitcoin, highlighting the strong up-trend in place. As you can see, Bitcoin remains inside a 5-year rising channel marked by each (1). And the recent rally has this popular crypto testing its 3.618% Fibonacci extension level as well as last year’s highs at (2).
Bitcoin Breakout Coming Next?
If Bitcoin can break out to new highs at (3), it could go much higher. Perhaps the next channel resistance, which comes into play around the $250,000 level?
Disclosure: Sign up for Chris's Kimble Charting Solutions' email alerts--click here.


