
Bitcoin Now Moving Lower To Test Some Key Levels As Volume And Volatility Continue To Drain Away
The daily chart for Bitcoin is one I have referenced a number of times over the last few months and it is now starting to approach some key levels. In addition, the price action coupled with volume is particularly revealing for the medium term.
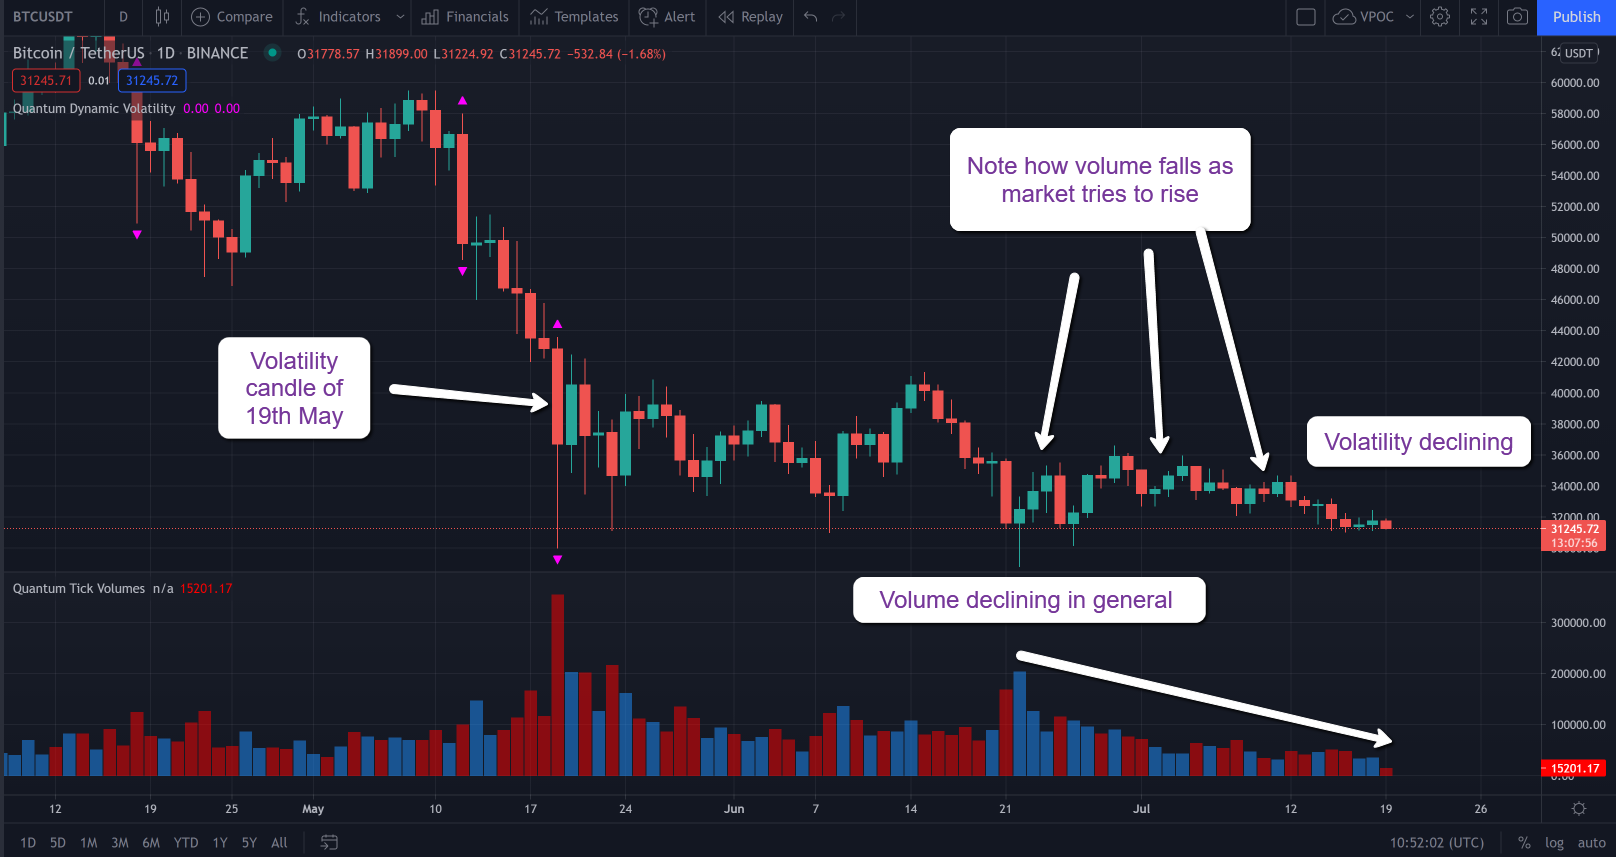
If we start with the candle which dominates the chart which is the volatility candle of the 19th May that resulted in Bitcoin plunging lower, only to recover on extreme volume as the buyers moved in to pick up the bargains. The volatility indicator is shown with the magenta triangles on top and bottom of the candle and signals the price in the session has moved outside the average true range. The significance is that we can expect the price to either consolidate within the spread of the candle or reverse. In this case, we have the former and for the development of any trend we have to wait for the high and low of this candle to be breached, a point we are now approaching to the downside. However, in addition to the key level now in sight at $29,958, there are also some more worrying signs for Bitcoin and cryptocurrencies in general.
First, is the general decline in volume and more particularly on any rallies. Note how weak each rally has been as the market attempts to rise with falling volume which is not a good sign for Bitcoin bulls. Second, is the lack of volatility which has drained away completely. This in itself is worrying as volatility is one of the key characteristics of all cryptocurrencies. So we have two major concerns, a lack of volume and volatility.
As I mentioned in a previous post, this chart is setting up as a perfect example of Wyckoff’s second law of cause and effect. In other words, the longer a market is in congestion then the greater will be any trend once the market breaks away and this is likely to be the case here. It is the analogy of an old-fashioned clockwork spring, where the more it is wound the greater the store of energy when it is duly released. What appears to be setting up here is a move to the downside, given that each significant attempt to rally fails at a lower price level. Since the 19th of May, the first effort saw Bitcoin reach $40,000 and beyond, whilst in subsequent and more recent rallies $36,000 has been the limit with $34,000 the most recent.
Volume always reveals the true picture and until we see some sustained buying, it looks as though Bitcoin will continue to slide towards the $29, 958 area, and at which point it will be a question of moving to the weekly and monthly charts for a view of where it is heading next.
(Click on image to enlarge)
Disclaimer: Futures, stocks, and spot currency trading have large potential rewards, but also large potential risk. You must be aware of the risks and be willing to accept them in order to invest in ...
more

