
Bitcoin: Moment Of Truth

Evergrande Black Swan
The market has been trying to discount the Evergrande news - the Chinese company that is about to default on billions in liabilities. It remains to be seen if the government will bail out the company. If no deal is forthcoming, there will be volatility in world markets.
According to the NY Times: Control of the banking system gives Beijing the tools to stop a broader collapse, officials believe while censorship and police powers can stifle protests.
The financial world is watching the struggles of China Evergrande Group, one of the largest property developers on earth and certainly the most indebted. Last week, a deadline to make an $83 million payment to foreign investors came and went with no indication that Evergrande had met its obligations, raising questions about what would happen if its huge debt load went sour.
China announced a ban on cryptocurrency transactions, the latest in a series of crackdowns on virtual money that comes as countries around the world are considering tougher regulations of their own.
Bitcoin
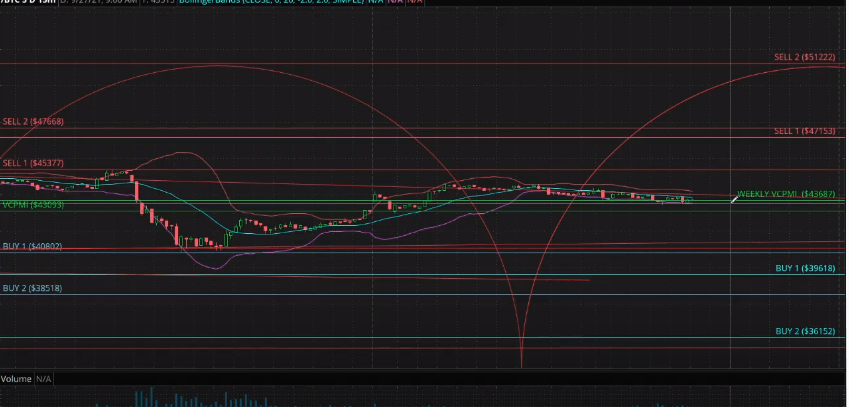
Courtesy: ema2trade.com
Bitcoin has almost regained what it lost last week. It is showing resilience. It is trading around the weekly average price of 43687. The weekly initial targets are 47153 to 51222, which are levels that represent areas of resistance or distribution of supply. Supply is likely to come into the market at those levels. If Bitcoin goes above the Sell levels, then they become support for the next higher fractal in price.
Our proprietary Robo-Advisor, Nikki the Robot, relying on our AI algorithm, the Variable Price Momentum Indicator (VC PMI), reported that for Bitcoin, the weekly SMA of 44943 is bearish. The weekly VC PMI of 43687 indicates a bearish price momentum. A close above 43687 stop will negate this bearishness to neutral. If you’re short, take profits at 39618 and 36152. If long, exit at 47153 and 51222.
We are trading around the weekly average, which is a choppy area. We have come up from 40802, which was the VC PMI daily buy signal. The daily and weekly targets, which is the weekly average price, were completed.
Bitcoin has almost regained what it lost last week. It is showing resilience. It is trading around the weekly average price of 43687. The weekly initial targets are 47153 to 51222, which are levels that represent areas of resistance or distribution of supply. Supply is likely to come into the market at those levels. If Bitcoin goes above the Sell levels, then they become support for the next higher fractal in price.
The signal for day traders is neutral right now. The market is most likely to trade at the extreme above the average price of 47153 or come down to the level of 39618. The buy level is where buyers are likely to come into the market and where you want to accumulate long positions.
When you go long, you can put a protective stop on a close below your entry pivot point. We do not recommend using straight stops, because if you do, you are likely to get stopped out. You can also choose to use a maximum dollar-based catastrophe stop - we use a $1,000 maximum catastrophe stop on our trades. Your amount will vary, depending on your comfort level. The third option is the level below, which is the Buy 2 level on a close below.
When the market is trading around the average price, there’s a 50/50 chance of it going up or down, so we do not trade when markets are trading around the average price. We wait for extreme prices when the trades have higher probabilities of success.
Disclosure: I/we have a beneficial long position in the shares of BTC-USD either through stock ownership, options, or other derivatives.
To learn more about how the VC PMI works and receive weekly ...
more

