
Bitcoin, Low-Hanging Fruit
Is there such a thing in financial markets? An easy trade? A sure thing? Not that we know of! You have to be quite creative and inventive to get to the point that market play gets easier. When you watch professional sports, super athletes make it look so easy when they score, but that is all a result of hard work and long hours of training. Today, we want to share one element of our work that helps stack one’s odds to make some profits consistently. Bitcoin, low-hanging fruit.
Once in a high likely entry zone, like the daily sideways channel on Bitcoin over the last weeks, the questions arise:
- Will prices break higher or lower?
- If to buy, when and where to buy?
- How much should I risk?
BTC-USD, Daily Chart, Bitcoin, low-hanging fruit, What has changed since last week?
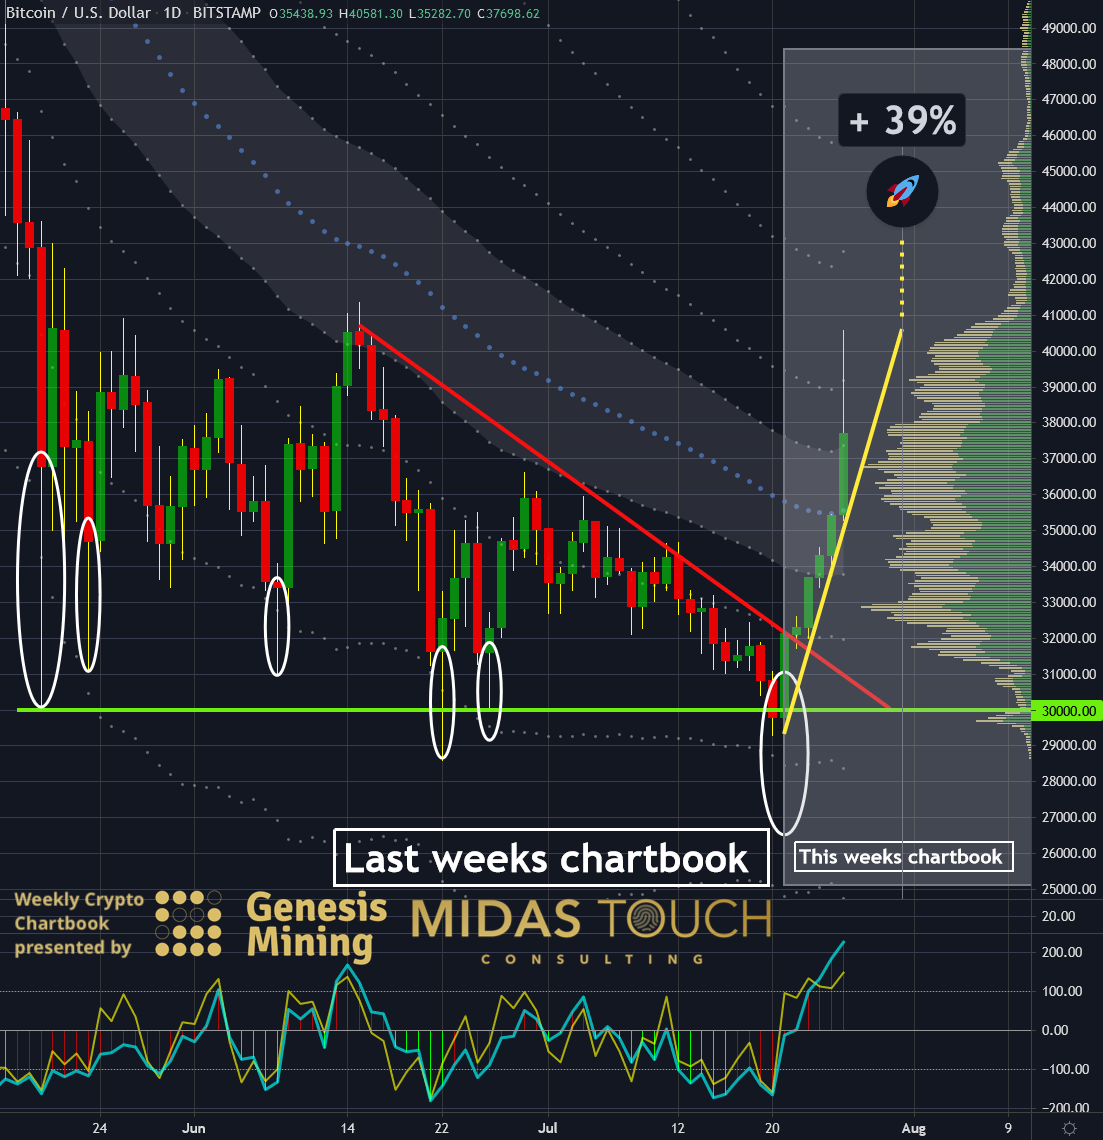
Bitcoin in US-Dollar, daily chart as of July 27th, 2021.
The daily chart above shows what has changed since last week’s chartbook release.
A week ago, we wrote: “In the daily chart above, you can see a possible turning point in the making. We would not be surprised if prices penetrate the range violently to quickly reverse, creating a wick, as it has in the past (white circles).”
A good plan was created, and the markets matched our expectations. But how were we able to end up with six long positions that all produced already booked partial profits? Let us explore the answers to the three questions asked earlier.
BTC-USD, Daily Chart, Will prices break higher or lower?
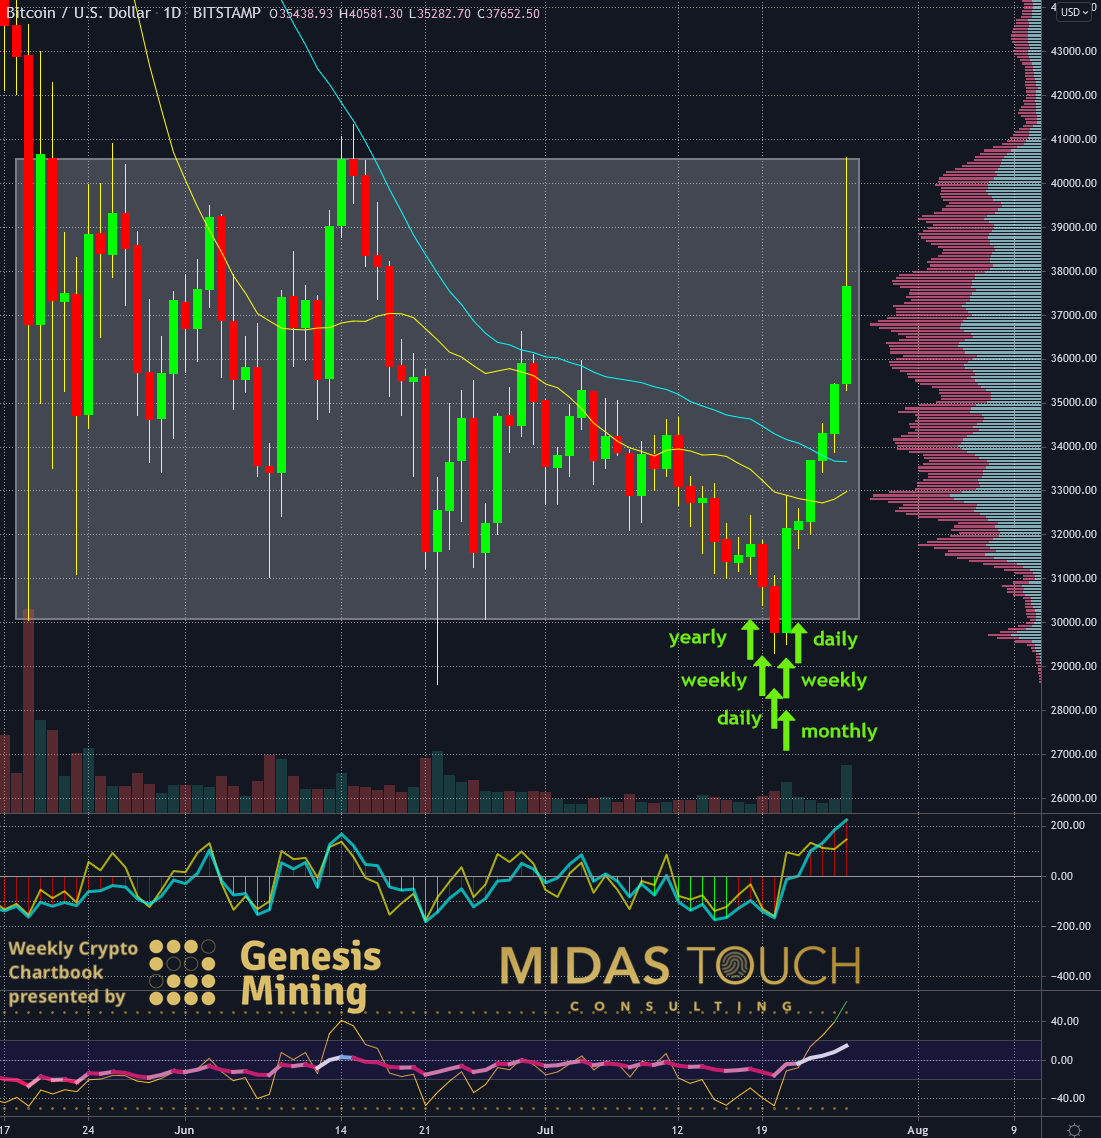
Bitcoin in US-Dollar, daily chart as of July 27th, 2021.
Answer to question 1: No one knows for sure in which direction a channel breaks, but one way to stack the odds in your favor is trading across multiple time frames. If you get signals within a short period for monthly, weekly, daily (yearly) time frames, the likelihood for a reversal just got stacked in your favor.
We got a yearly signal entry on July 18th and a weekly entry signal on July 19th. A daily entry on July 20th followed. On July 21st, we were filled on yet another weekly and a monthly setup long for Bitcoin. And the next day, on July 22nd, we had yet another daily long signal.
This entry frequency across all time frames in a very short time gave us confidence that the turning point had a high probability, and indeed, prices turned. We already were able to take early profits through our quad exit strategy to eliminate risk and book partial profits (all entries and exits were posted in real-time in our free Telegram channel).
So, in short, you do not have to worry if you employ various systems for sideways markets and trending markets and trade all time frames; the worry gets taken off your shoulder by a self-regulatory system.
BTC-USD, Daily Chart, If to buy when and where to buy?
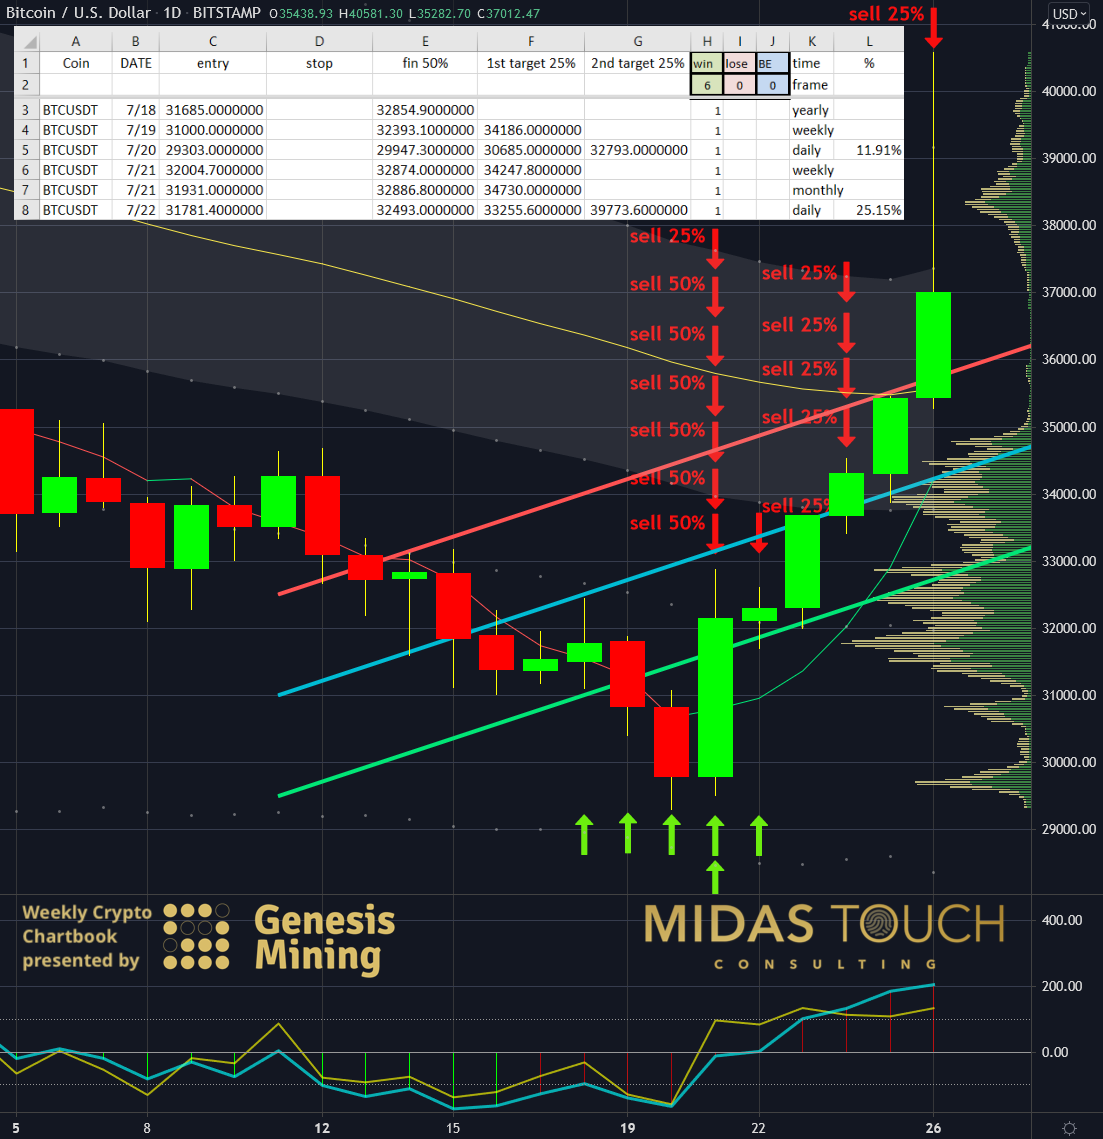
Bitcoin in US-Dollar, daily chart as of July 27th, 2021.
Answer to question 2: Take every low-risk entry point as you would typically, even though you feel uncomfortable with them coming in such a short period of time. You will need a quad exit strategy or a similar exit strategy to reduce risk quickly.
We posted about two dozen of these more significant turning points live in our Telegram channel over the last 3.5 years with a hit rate above eighty percent. No need for greed, though. Simply exit your targets, as usual, to mitigate risk, as we have.
The chart above shows the actual values of our entries and exits so far. We touched the upper bound of the channel and have now still five units exposed to the market. That is more than one full trade size-wise, with the advantage now that these remaining parts of the trades are psychologically untainted and easy to let ride further should a true trend continuation on the larger time frames unfold.
Two more points are noteworthy. All entries came within less than a week. And more than half of the total position size gets cashed in on the first burst up within a day. It is this low-risk exposure and risk elimination in a brief period of time that we are after.
BTC-USD, Daily Chart, How much should I risk?
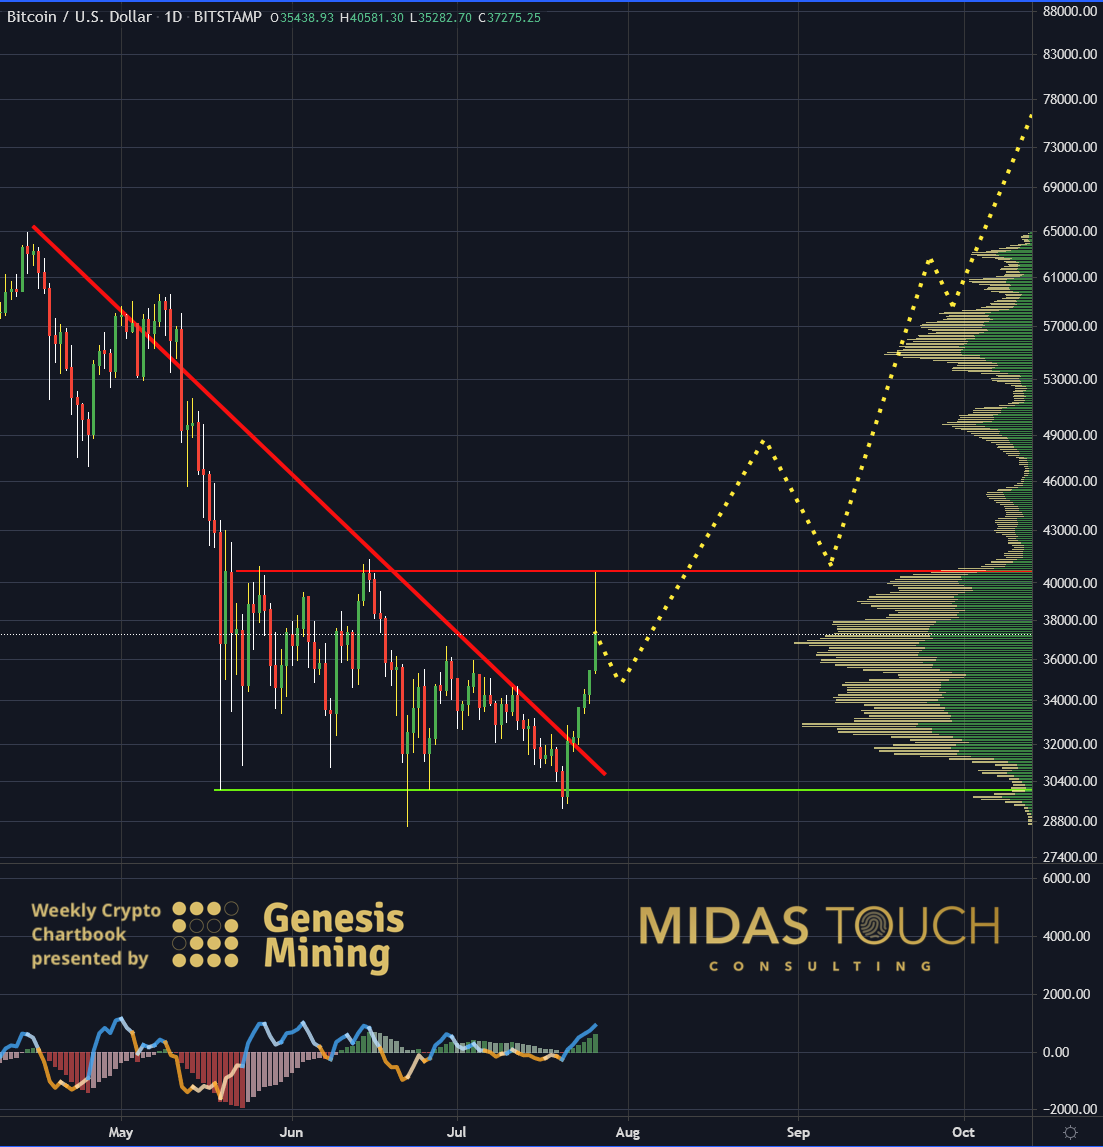
Bitcoin in US-Dollar, daily chart as of July 27th, 2021.
Answer to question 3: Assume a maximum of ten trades simultaneously, which reduces your typical 2% maximum risk per trade to 0.2% per trade on total investment capital. The idea here is not to leverage or pyramid, but to increase odds and minimize risk for a more significant turning point.
This means you do not want to have a more extensive total exposure at any time of 2% of your total investment capital of correlated trades. Why? A 27% loss is about the breaking point of systems where you can still recover from a loss. Remember, when you lose 50% on a position, you now need to make a 100% gain to be at break even. You do not want to mess with this principle being stacked against you. There is a near 100% certainty of 13 losses in a row in a thousand sample size. Take these times two percent, and you find the logic of why the “maximum 2% rule” is sensible.
Looking at the chart above, you can see why this aggressive entry behavior is almost necessary with Bitcoin. Once in motion, Bitcoin is hard to stop and moves without a breath through the entire range within a week. Later entries are higher-risk trades.
While Bitcoin typically retraces quite strongly, we are confident that we might see a second leg coming shortly. We do not trail stops at this time any further than towards break-even entry levels.
Bitcoin, low-hanging fruit:
It is tough to step up to the plate and that with size, after a more extended period of a drought of trades. And yet, exactly this is one of the best ways to make money!
It requires confidence, a lot of focus, discipline, and a clear, refined rule set. In the case of the above-described scenario, it is the self-regulating aspect of the trading system by trading through various time frames to identify a high likely turning point. While each trade is low risk, the sum of transactions and, more importantly, the tight time interval of occurrence of entries guides towards a higher likely probability of prices to move through a reversal phase.
It is imperative to back and forward test one’s systems if it is in alliance with this principle. We have found that in more cases than not, it is and, as such, encourage you to have a look if our methodology might fit your trading system as well.
Disclaimer: All published information represents the opinion and analysis of Mr Florian Grummes & his partners, based on data available to him, at the time of writing. Mr. Grummes’s ...
more

