
Bitcoin, Ethereum Crumble, Alt-Coins Hammered - Will Buyers Step Back In Again?

BITCOIN (BTC/USD), ETHEREUM (ETH/USD), AND ALT-COINS PRICE, ANALYSIS AND CHART:
- Cryptocurrencies slump - US capital gains tax fears cited.
- Turkish cryptocurrency exchange Thodex crashes, clients unable to access assets.
- Fourth double-digit sell-off this year – volatility is back with a bang.
A sharp sell-off in cryptocurrency may offer further opportunities to get onboard the crypto-train if the prevailing market narrative is to be believed although the volatile nature of the move may cause some to hold back for a while. The last leg of the recent sell-off is thought to be due to US President Joe Biden’s capital gains tax proposals for the wealthy, although this plan may prove difficult to get through the house. The recent sell-off has knocked nearly $500 billion off the market’s capitalization, now $1.838 trillion, so if buyers are interested, they will have the opportunity to pick up coins at a decent discount to recent levels.
TURKISH CRYPTO EXCHANGE UNDER FIRE
Another negative for the cryptocurrency market this week was news that the Turkish crypto exchange, Thodex, had shuttered, leaving tens of thousands of investors at risk. The Turkish authorities - already looking to ban cryptocurrency transactions – have today launched an investigation into the platform and detained 62 people involved with the Istanbul-based exchange. The company’s founder and CEO, Faruk Fatih Ozer, was not arrested as he is feared to have already fled the country.
ALT-COINS UNDER PRESSURE
The largest losses seen over the last week have been in the alt-coin space with heavy double-digit reversals seen across the board. The alt-coin market has been in overdrive this year with many coins shows huge gains, the most prominent example being Dogecoin which at one stage was up 8,000% since the turn of the year. A lot of alt-coins have very small market capitalizations and trade at a fraction of a dollar, with buyers hoping that they have found, and got it on, the ‘next Bitcoin’ ahead of the crowd.
WILL HISTORY REPEAT ITSELF?
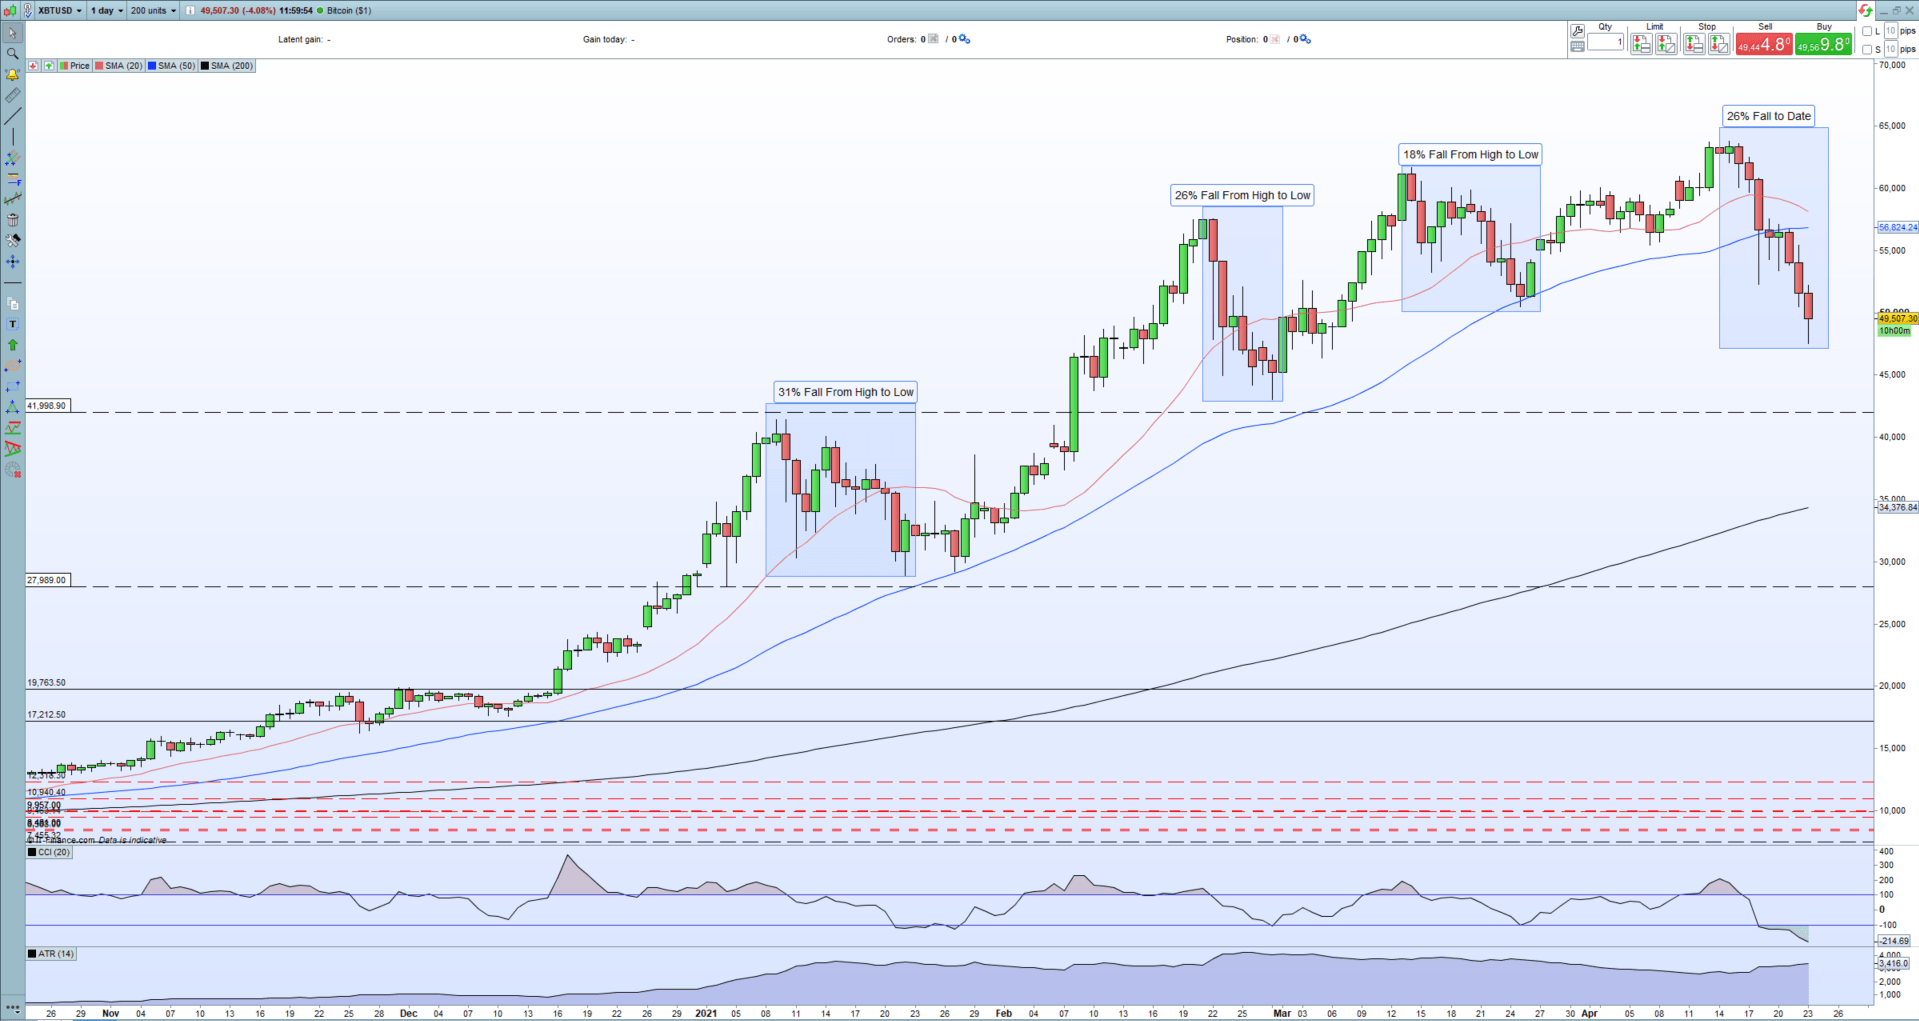
While the current market is under pressure, a look at Bitcoin’s daily chart over the past few months shows that double-digit sell-offs and subsequent recoveries have already happened three times this year. This may give hope to holders and new investors who will cite history repeating itself for being in the market. The daily chart also clearly shows the oversold nature of the market, using the CCI indicator, and this may add to the bull’s arguments. The technical set-up however tells a slightly different story with the recent sell-off negating the bullish series of higher lows. Bitcoin has also made a decisive break below the 50-day simple moving average, a technical indicator that has provided support since October 2020.
BITCOIN (BTC/USD) DAILY PRICE CHART (OCTOBER 2020 – APRIL 23, 2021)
Ethereum has been making headlines this week as it continues its recent outperformance of Bitcoin. The Ethereum/Bitcoin spread hit its highest level since August 2018 yesterday, before backing off today. When this market settles down, this trend looks likely to resume.
Disclosure: See the full disclosure for DailyFX here.


