
Bitcoin (BTC/USD) Support Test As Ethereum (ETH/USD) To Fresh Highs
It’s been a big 24 hours in the crypto space. Not only did yesterday see Bitcoin set another fresh all-time-high, but Coinbase saw strong uptake of their IPO that valued the company at approximately $100 billion. Considering that Goldman Sachs has a market cap of $117 billion, that’s an impressive outing for the 12-year old company.
Ahead of the listing, Bitcoin prices put in a strong breakout beyond the 60k psychological level. I had looked into this last week, highlighting a bull flag formation that had built in BTC/USD. Such formations are often followed with the aim of bullish continuation, and from the recent breakout that’s precisely what’s happened thus far.
BITCOIN (BTC/USD) FOUR-HOUR PRICE CHART
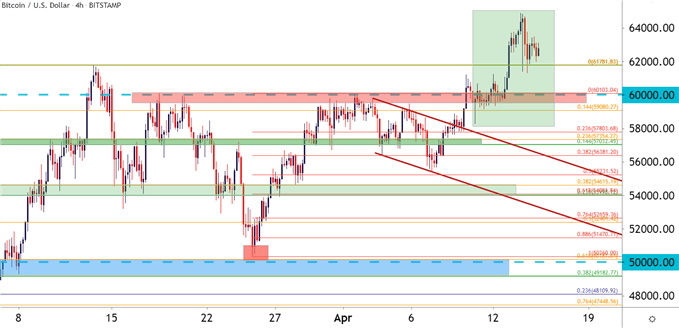
Chart prepared by James Stanley; Bitcoin on Tradingview
BITCOIN ATTEMPTING TO HOLD SUPPORT AT PRIOR RESISTANCE
Following that breakout to fresh highs, bulls backed-off and prices have pulled back. Already it appears that some support is playing in off of the prior all-time-high, plotted to around 61,781. Today marks the second day in which bulls are trying to hold support in this area, which could keep the door open for bullish continuation scenarios for those looking to treat the matter aggressively.
For those that’d like to be more patient, the 60k level could hold some interest for higher-low support, as the psychological level had stalled the move for a couple of weeks but, as yet, hasn’t been tested for support.
BITCOIN (BTC/USD) DAILY PRICE CHART
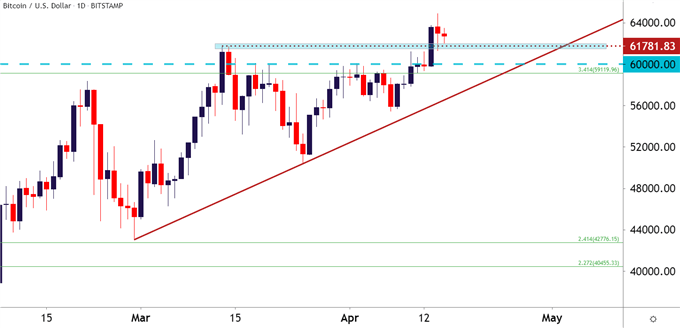
Chart prepared by James Stanley; Bitcoin on Tradingview
ETHEREUM CONTINUES DRIVE TO FRESH HIGHS – 2500 IN SIGHT
Ethereum continues to impress, setting fresh all-time-highs on four of the past six days. It took the cryptocurrency a little over a month to finally leave the 2k psychological level behind, and now the coin is fast approaching another possible inflection point at the 2500 marker.
In a market such as Ethereum, where prices are doing something that’s never been seen before, psychological levels can take on an important role because its one of the few support and resistance mechanisms that may have any usability. The resistance inflection at 2k led into a retracement of more than 35%, likely driven by longer-term bulls shaving off positions after a new big figure had been traded at.
But now that the coin has traded aggressively above this line in the sand, the big question is where it might stop, and there’s a dearth of historical implication to draw from. That 2500 level is also confluent with the 161.8% projection from the prior pullback, given perhaps even more motive for price action to pause or, perhaps even pullback when engaging with the psychological level for the first time.
ETH/USD DAILY PRICE CHART
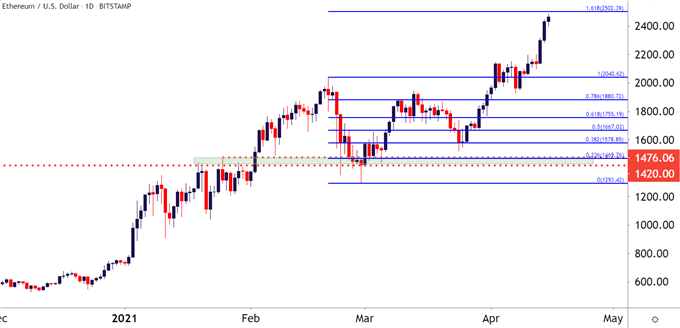
Chart prepared by James Stanley; Ethereum on Tradingview


