
Bitcoin (BTC/USD) Price Forecast: Boom Or Bust For Bitcoin Bulls Above $52,000?

After three consecutive months of gains, Bitcoin (BTC) bulls managed to drive price action past the critical resistance level of $50,000. After the formation of a spinning top on Thursday, the discouraging job data that emerged from the release of Non-Farm Payrolls (NFP) weighed on the greenback, buoying the demand for both major cryptocurrencies and alt-coins.
However, as the United States celebrates labor day, a slight recovery in the USD hindered bulls ability to drive prices above $52,000. While this level continues to hold firm as critical resistance for the imminent move, technical indicators suggest that a breakout towards either side is likely given the key levels currently in play.
With global interest rates at near-record lows, inflationary pressures continue to rise while the spread of the delta variant continues to disrupts the recovery process. The fundamental backdrop appeared to be a positive catalyst for the crypto sphere allowing Bitcoin to retest $50,000.
Bitcoin (BTC/USD) Price Analysis:
Bitcoin (BTC/USD) bulls may be losing steam after a strong recovery from the July low where prices plunged below $27,000. The rebound in price action is a reminder of the volatile nature of the crypto realm and the unpredictable nature of the industry.
At the time of writing, Bitcoin bulls are currently resting above $51,000 while bears struggle to push prices back below the critical support level of $50,000. The formation of a doji candle on the daily chart below, may be a warning that the momentum of the uptrend is losing steam at the 50% Fibonacci level of the 2020-2021 move.
For now, prices remain above the 20-day moving average while a crossover of the MACD (moving average convergence/divergence) suggests that a breakout towards the upside is still probable.
Bitcoin (BTC/USD) Daily Chart
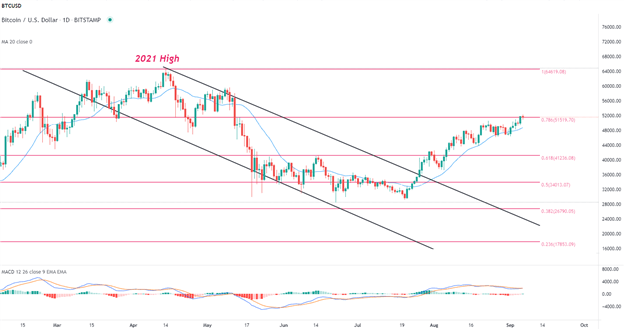
Chart prepared by Tammy Da Costa using TradingView
Likewise, the weekly chart below shows price action above the 20-period moving average and the MACD threatening the zero-line likely suggesting that the momentum of the intermediate to long-term is threatening to change direction.
Bitcoin (BTC/USD) Weekly Chart
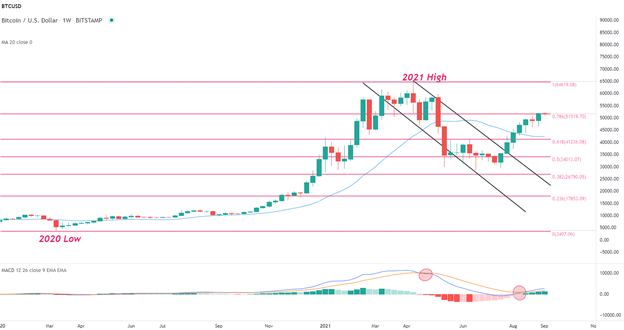
Chart prepared by Tammy Da Costa using TradingView
Disclaimer: See the full disclosure for DailyFX here.


