
Bitcoin (BTC/USD) Pressured As Ethereum (ETH/USD) Probes New Highs
Bitcoin and Ethereum traded fairly mixed during Thursday’s trading session. BTC/USD price action is pacing an arguably modest -3.5% decline while ETH/USD is off roughly -1.3% after hitting a new intraday record high at the 2,800-price level. Elsewhere in the realm of popular cryptocurrencies, Litecoin and Dogecoin dropped -2.7% and -5.5% respectively, though Ripple was able to eke out a 1.6% gain.
Lack of demand for cryptos seems to follow an upswing in Treasury yields and a somewhat firmer US Dollar. Also, the subtle remark from Fed Chair Powell during his post-FOMC decision press conference yesterday about how there is ‘some froth in markets’ may have curbed trader risk appetite for speculative assets such as Bitcoin. That said, more dominant fundamental drivers, like mounting private sector acceptance and increasing use in transactions, stand to keep the cryptocurrency market broadly supported.
BTC/USD – BITCOIN PRICE CHART: DAILY TIME FRAME (27 DECEMBER 2020 TO 29 APRIL 2021)
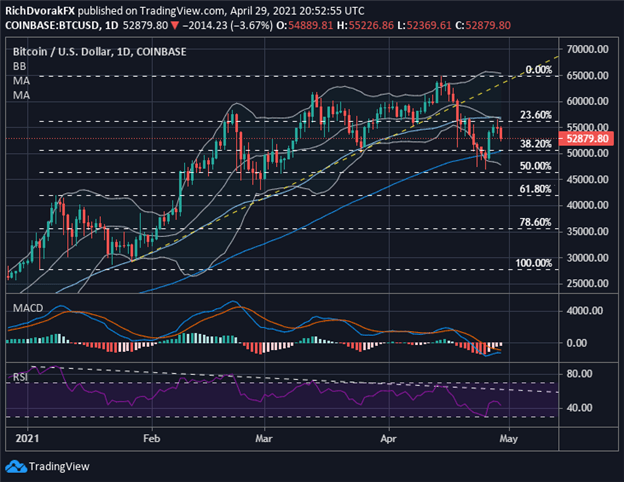
Chart by @RichDvorakFX created using TradingView
BTC/USD price action also looks to be struggling after failing to take out the $56,000-price level. This area of technical resistance is emphasized by a confluence of the 20-day and 50-day simple moving averages. We recently noted that short-term outlook for Bitcoin was bearish below its 50-day simple moving average, and this still seems to be the case. This brings to focus potential for another support test of the psychologically significant $50,000-price level, which is underpinned by the 100-day simple moving average and 38.2% Fibonacci retracement of its year-to-date trading range.
ETH/USD – ETHEREUM PRICE CHAT: DAILY TIME FRAME (26 JANUARY TO 29 APRIL 2021)
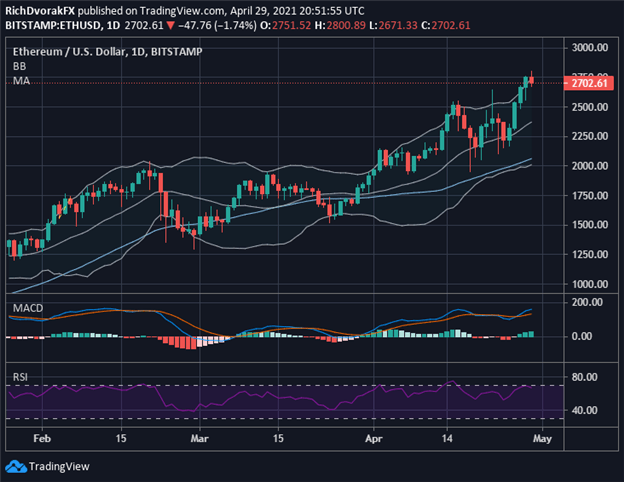
Chart by @RichDvorakFX created using TradingView
Ethereum, in contrast to Bitcoin, continues to fluctuate around its respective all-time highs. ETH/USD price action has faced headwinds around the 2,800-level, however, with advances being relatively contained by the upper Bollinger Band. Ethereum is also flirting with ‘overbought’ territory judging by its relative strength index. In the absence of continued Bollinger Bandwidth expansion, potential for a healthy consolidation lower grows more likely. This could bring the 20-day simple moving average into focus before Ethereum bears set their sights on technical support near the critically-important 2,000 price level.
Disclosure: See the full disclosure for DailyFX here.


