
Bitcoin (BTC/USD), Ethereum (ETH/USD) Caught Between Key Moving Averages
With the cryptocurrency market recently overrun by sellers, perhaps due to traders reducing risk across speculative asset classes amid surging bond yields, Bitcoin and Ethereum have both faced considerable downward pressure. BTC/USD price action tumbled roughly -20% from its record close while ETH/USD plunged nearly -30% from its all-time high in what initially appeared to be a healthy correction. Bitcoin and Ethereum staged notable rebounds yesterday in attempt to claw back recent losses, but it seems as though crypto bulls are struggling to sustain the bid. Despite increasing private sector adoption of top cryptocurrencies, this may leave BTC/USD and ETH/USD at risk of deeper pullback potential in the short-term.
BTC/USD – BITCOIN PRICE CHART: DAILY TIME FRAME (21 NOV 2020 TO 02 MAR 2021)
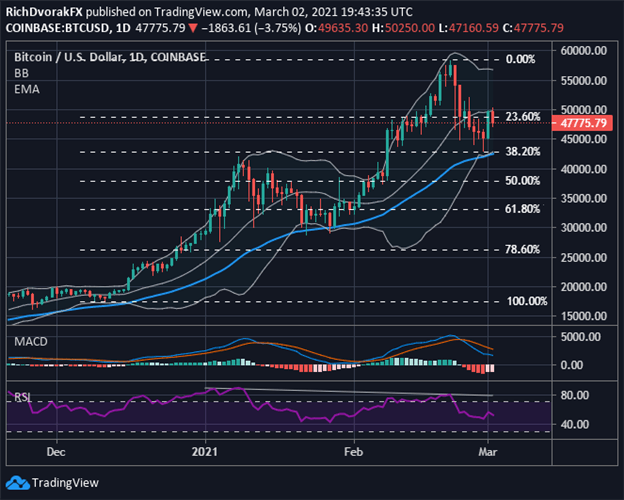
Chart by @RichDvorakFX created using TradingView
Bitcoin volatility over the last two weeks has sent BTC/USD price action swinging within a massive $15,000-range. The biggest cryptocurrency by market cap now looks wedged between two key technical levels underpinned by its 20-day and 50-day moving averages. BTC/USD rejecting the psychologically-significant $50,000-price level could suggest risk remains tilted in favor of the bears.
A breakdown of confluent support around $43,000 might motivate Bitcoin sellers to set their sights on January’s swing high. Below this, the mid-point and 61.8% Fibonacci retracement levels highlighted on the chart above stand out as the next possible layers of defense. On the other hand, maintaining the broader bullish trend and eclipsing the 24 February close could reignite upward momentum and bring $60,000 into focus.
ETH/USD – ETHEREUM PRICE CHART: DAILY TIME FRAME (21 NOV 2020 TO 02 MAR 2021)
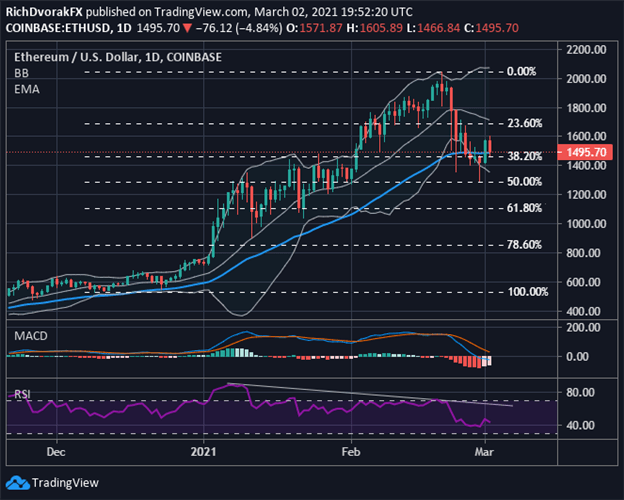
Chart by @RichDvorakFX created using TradingView
Ethereum has been hit harder by the cryptocurrency market selloff relative to its Bitcoin peer. ETH/USD price action was similarly hammered lower to its 50-day moving average, but the rebound off this technical support level looks much less inspiring. This could indicate trader sentiment surrounding the cryptocurrency market remains downtrodden.
That said, sliding below this key barrier could see a resumption of selling pressure and continuation along the bottom Bollinger Band. ETH/USD might recoil toward its 20-day moving average, however, if bulls can keep Ethereum afloat around the $1,400-price level. Surmounting the 20-day moving average may bring all-time highs back into consideration.
Disclosure: See the full disclosure for DailyFX here.


